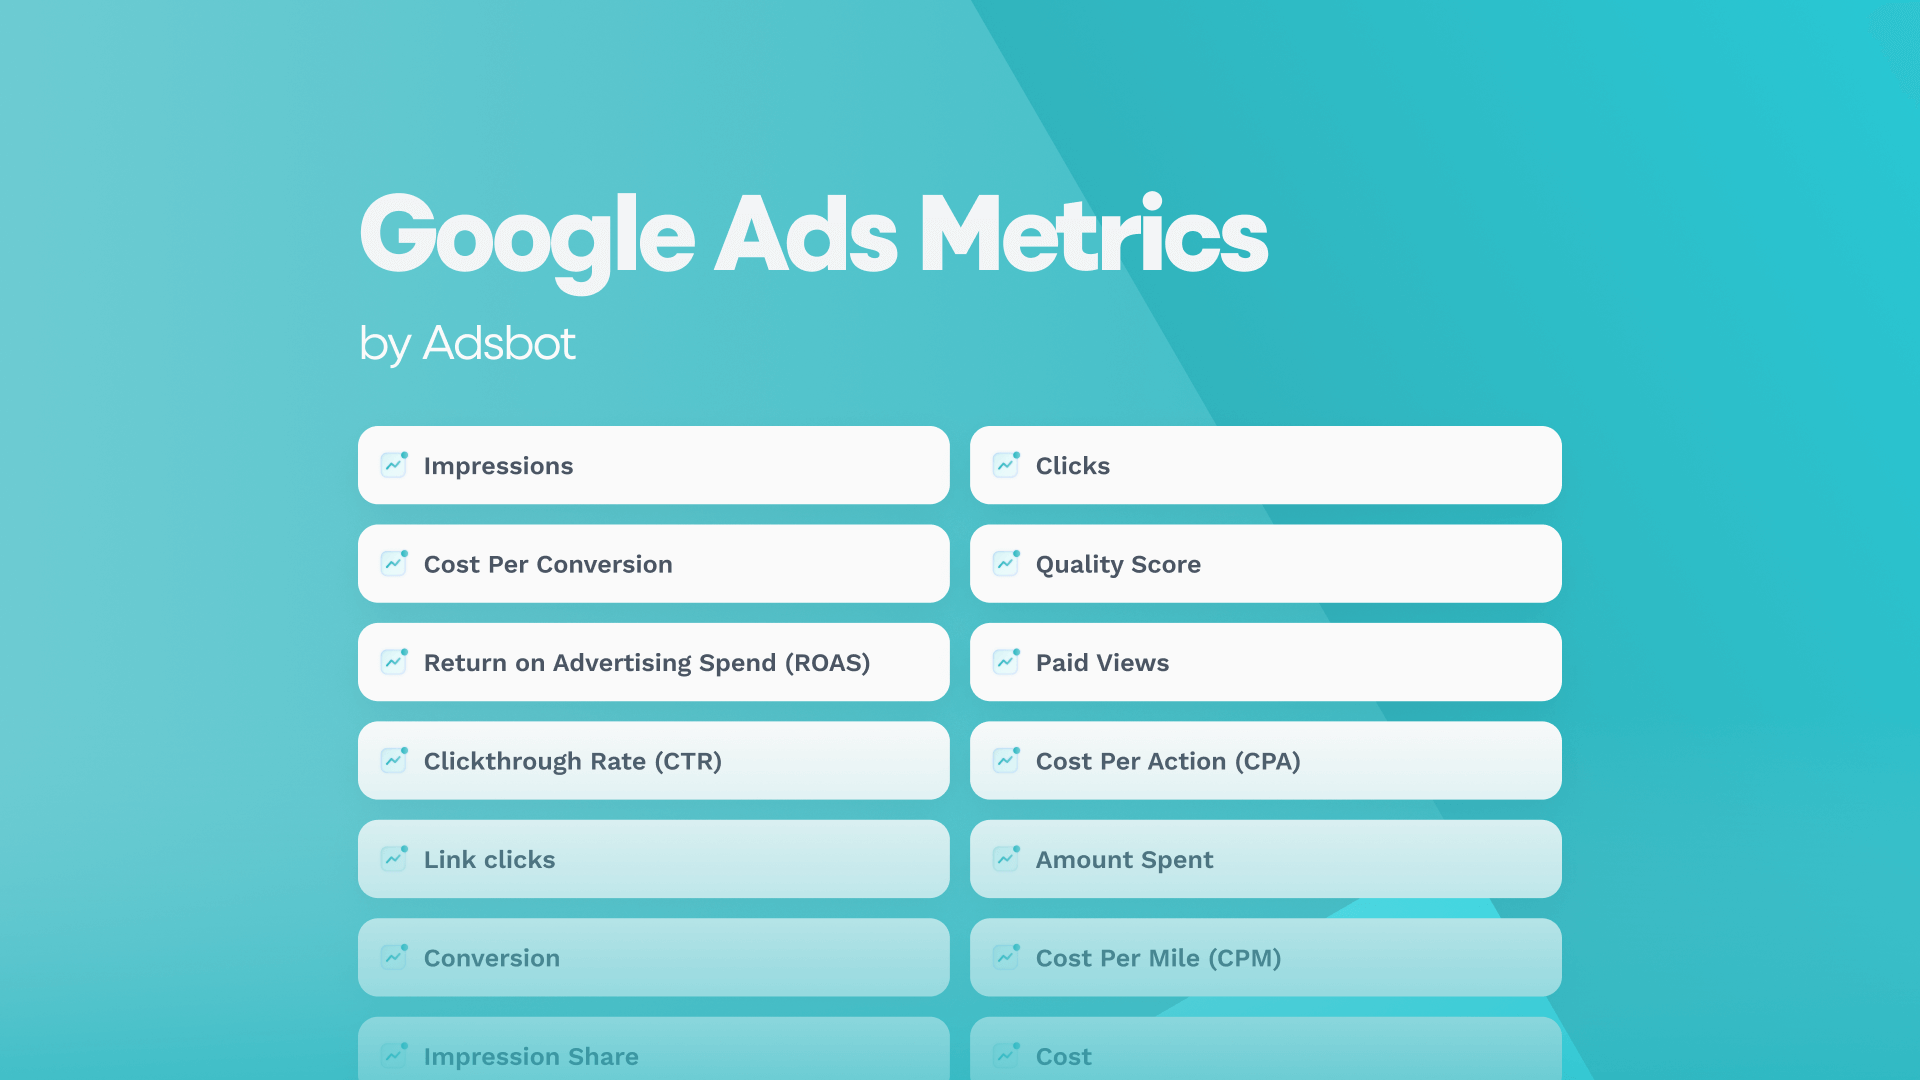
Are you ready to take your digital marketing strategy to the next level? Are you interested in learning more about Google Ads and Google Ads metrics? If so, then this blog post including Google Ads metric list is for you! Here, we’ll explore the different Google Ads key metrics and how they can help improve your campaigns.
Impressions
The impressions metric shows you how many times your ad has been seen. Content impressions are not the same as link clicks, though the number of impressions can give you an idea of how well your ad is performing in comparison to others. To increase this metric, you may want to increase your campaign budget, as well as optimize your target audience and bids to reach more potential customers.
Clicks
The number of clicks your ad receives daily is a key metric to monitor, as it provides an indication of how relevant your ad copy is to your audience. When combined with impressions, it gives you an understanding of the effectiveness of your Adwords campaign – the higher the ratio of clicks to impressions, the more successful your ads will be. Moreover, this metric can help you determine your Cost Per Click (CPC) and Cost Per Action (CPA).
Cost Per Conversion
Cost Per Conversion is one of the most important Google Ads metrics, as it measures how much money is spent in order to generate a conversion. To calculate the CPC, you take the amount of money spent on an ad campaign and divide it by the number of conversions (customers) over the same period. It’s an easy metric to measure, as all that’s needed is to divide the total cost of ad interactions (such as clicks for text ads or views for video ads) by the value of all conversions. This metric is a good indication of how much money is being invested into each customer, making it an essential indicator of success with Google Ads.
Quality Score
Quality Score is a metric used by Google to evaluate the relevance and quality of your keywords, ads, and landing pages to determine your cost. It is given a numerical rating on a scale of 1 – 10 with 1 being poor and 10 being great, and is calculated based on factors such as keyword CTR, ad relevance, landing page experience, and more. Quality Score plays a major role in how well your Google Ads perform, as it determines how often people will see your ads and how much you pay per click. Improving your Quality Score can result in lower costs and higher returns on advertising spend (ROAS).
Return on Advertising Spend (ROAS)
Return on Advertising Spend (ROAS) is an important digital marketing and performance metric. It is calculated by dividing the conversion value (based on e-commerce revenue and/or goal value) by the amount spent on advertising. The overall ROAS for Google Ads is 200%, or $2 for every dollar spent. Your target ROAS is the average conversion value (for example, revenue) you’d like to get for each dollar you spend on ads. With Google Analytics, you can check ROAS data either in a Google Ads report or as a separate metric in the conversions report.
Paid Views
Paid views reveal the number of times viewers view a larger portion or the entirety of your ad, beyond just the impression. This metric can be useful for understanding how often an ad was viewed in its entirety, as well as what portion of the audience the ad was able to reach. It can also help to inform decisions on budgeting and targeting, as well as give Google Ads insight into how effective a campaign is at reaching its intended audience.
Cost Per Click (CPC)
Cost Per Click (CPC) is an online advertising metric used to determine the cost of showing users ads on search engines, one of the Google Ads campaign types Display Network for Ad Manager, social media platforms, and other publishers. CPC is calculated by dividing the total cost of a PPC campaign by the total number of clicks it receives. It is important to understand CPC when evaluating the success of your Google Ads campaigns, as it can help you identify how much you are paying for each click and whether or not you are getting an effective return on your advertising investments.
Cost Per Action (CPA)
Cost Per Action (CPA) is a key metric in marketing. It measures the cost to generate action through advertising. According to search marketing companies, the average CPA in Google Ads across all industries is $56.11 for search and $90.80 for mobile app users. CPA campaigns are often used by mobile marketers as it charges them only when app users take specific actions. It is important to keep track of this metric in order to understand how well your campaigns are performing and doing Google Ads optimization spending accordingly.
Clickthrough Rate (CTR)
Clickthrough Rate (CTR) is a metric that measures how often a link, ad, or email is clicked in relation to how many times it’s been viewed. It can be used to evaluate the success of an online marketing campaign. CTR is a key indicator of how effective an ad campaign is performing, and it can help marketers determine the best avenues to pursue when allocating budget for future campaigns. In Google Ads, the average CTR across all industries is typically 1.91%, while the average CTR for display ads on the Google Display Network is 0.35%. Advertisers should aim for a CTR that is at least above the industry average in order to maximize their return on investment. Additionally, improving quality score and increasing impressions can help boost CTR and make campaigns more successful.
Link clicks
Link clicks measure the number of people who clicked on your ad after seeing it. This metric is especially important if your objective is to drive website visits or clicks to a landing page. Understanding the number of clicks your ad receives is a good indication that your ad is resonating with the audience and achieving its objectives.
Amount Spent
The Amount Spent metric indicates the total money you have invested into your campaigns. It’s important to monitor this metric and make sure that your spending is in line with the goals of your campaigns. This metric will help you understand how much you are spending on a specific keyword or ad group and whether or not the investment is resulting in conversions.
Conversion
Conversion is a key metric that measures how many of the interactions with your ads result in a desired action. It’s calculated by dividing your total cost by the number in your “Conversions” column. This calculation only applies to eligible interactions (like ad clicks) and tells you the percentage of impressions that your ads outranked (showed above) another participant in the auction. Conversion tracking allows you to see which ads are driving the most conversions so you can make adjustments to your campaigns and get better returns on investment. All Conversion is a metric that measures the total number of conversions that happen on your website, regardless of whether they’re from clicks or other sources. Conversion measurement is essential for understanding how people are interacting with your ads, and it helps you gather insights and make key optimization decisions.
Cost Per Mile (CPM)
Cost Per Mile (CPM), also known as cost per thousand impressions, is one of the most popular metrics used to measure online advertising success. It helps to understand how much it costs an advertiser to gain one thousand impressions on their campaigns. CPM is calculated by dividing the cost of an ad placement by the number of impressions it generates. It is a great metric to track when attempting to optimize an online campaign for maximum efficiency and ROI. Also, you may want to learn what is the difference between CPC and CPM.
Impression Share
Impression Share is a metric that tells you what percentage of impressions your ads receive compared to the total number of impressions that your ads could get. It gives you a clear picture of how well your ads are performing and how much of the available market share you are capturing. Impression Share is an important metric to monitor when assessing your Google Ads performance, as it helps you gauge how well your campaigns are reaching their potential.
Cost
The Cost metric in Google Ads is the amount of money you are paying for your ad campaigns. It is measured in micros, so you need to divide by 1,000,000 to get the actual cost value. The Cost Analysis report shows metrics for “google/CPC” (Google Ads) and any other channel for which you upload cost data. Cost per click (CPC), the amount you pay for each click, is important because it ultimately determines the financial success of your campaigns. It is important to also keep an eye on related metrics such as return on advertising spend (ROAS) and cost per mile (CPM).
Google Ads has a variety of metrics that help to measure and analyze the performance of your Google Ads campaigns. These Google Ads performance metrics range from impressions, the number of times an ad was viewed, to CPC, the average amount you pay each time someone clicks on your ad. Quality score is a Google-given measure of the quality, relevance, and performance of your PPC advertising campaigns and can affect how much you pay for a click. Cost per conversion or acquisition (CPC/CPA) is the average cost per conversion or acquisition from your ads. The very left-hand column of the statistics table on the “Ads & Assets” page displays symbols that show whether the metric is increasing or decreasing from the previous period. Understanding Google Ads metrics can help you to optimize your campaigns for better performance and ROI.
How Does Adsbot Help You?
Adsbot helps you automate, optimize and analyze your campaigns in a minute. You can analyze metrics on your account with a single click. Besides, Get insights, alerts and smart recommendations with a single click. You will have a full control on your account and focus on strategy. Start you free trial today and see Adsbot in action.
Author:

Get 3x more revenue from the same ad spend.
Let our onboarding experts show you the power of AI-driven PPC optimization.
Start scaling today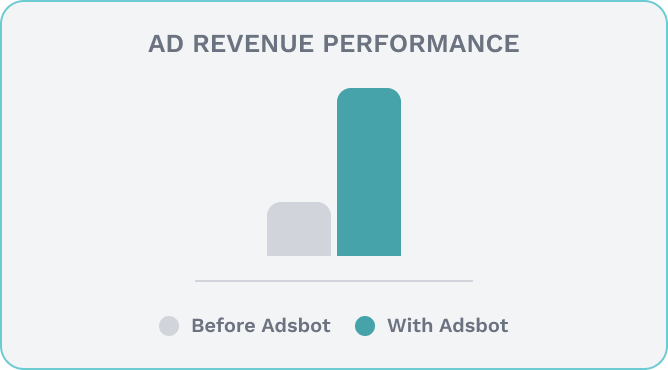
Popular Posts
-
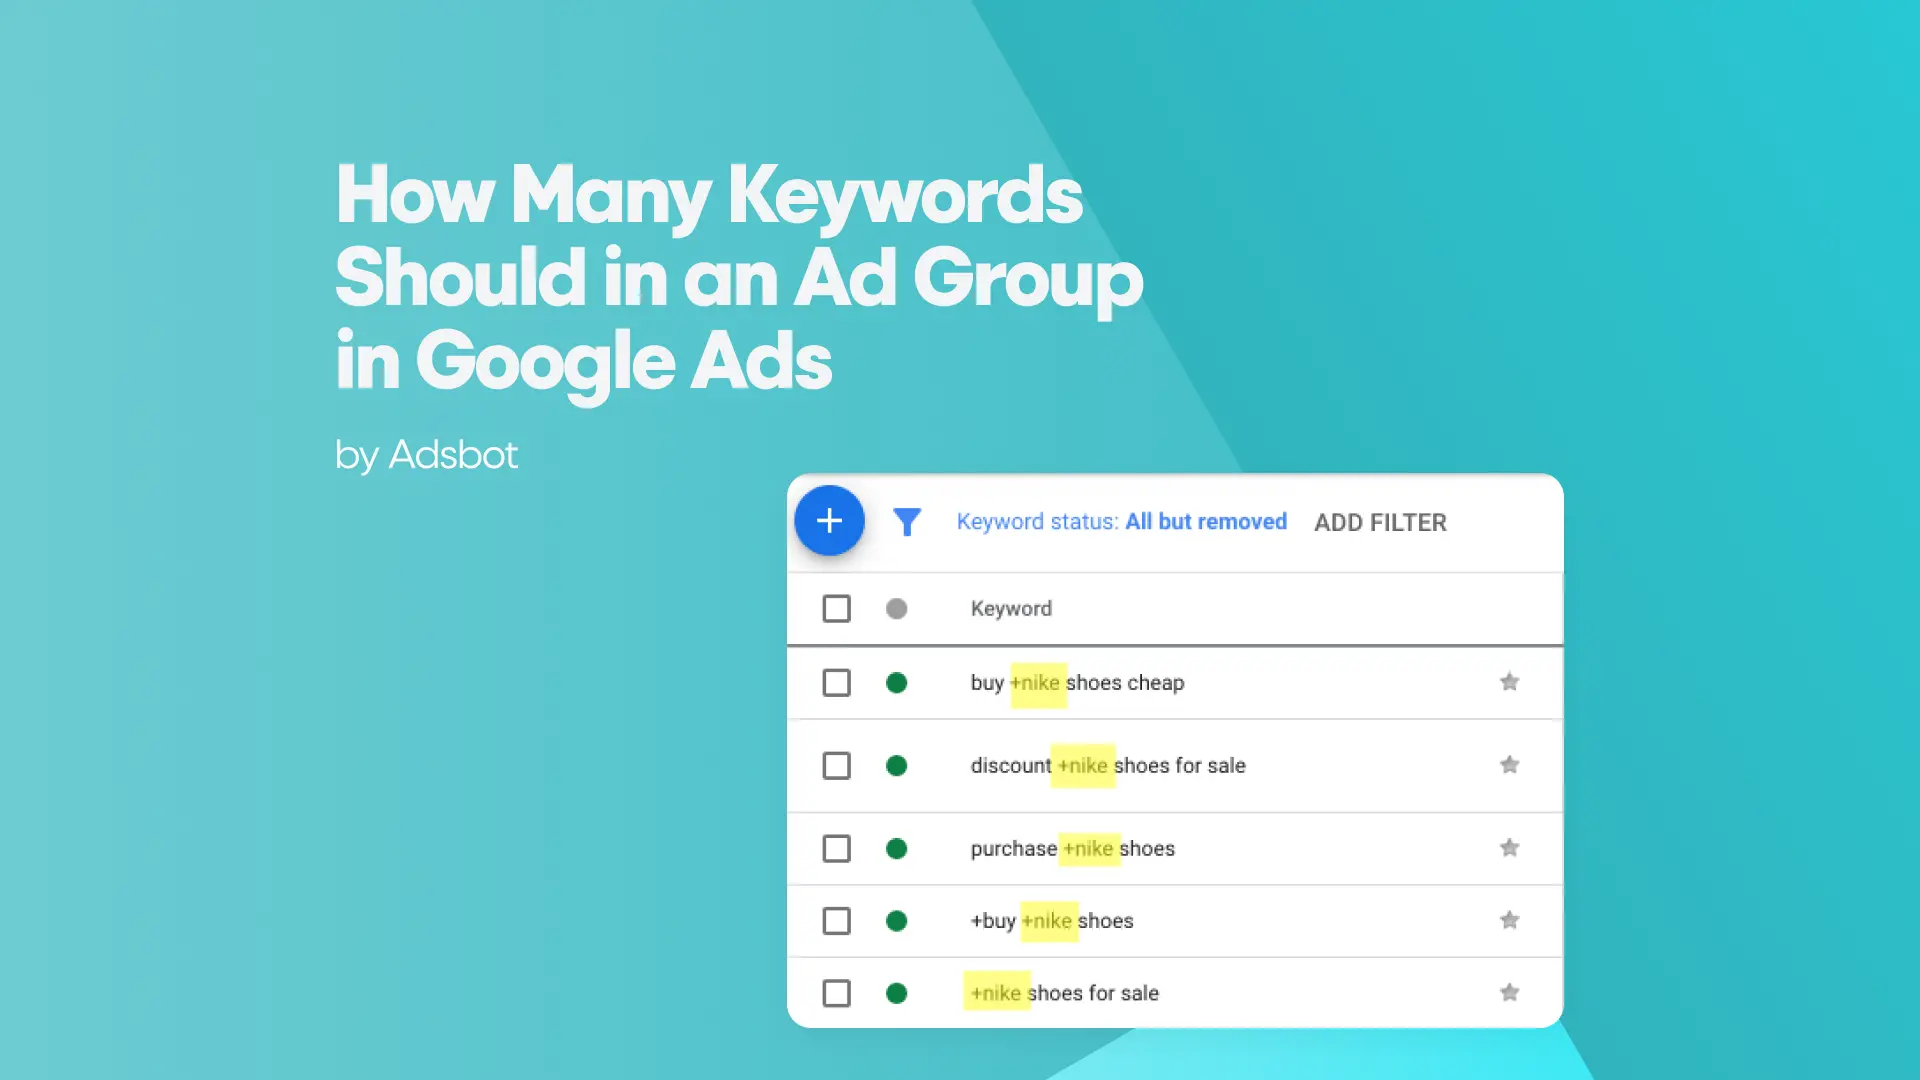
 How Many Keywords Should Be In an Ad Group in Google Ads?
For the vast majority of modern campaigns, the ideal number…
Read more -
 Google Ads Script for Dummies: An Introduction
Imagine you have an e-commerce website that sells licensed superhero…
Read more -
Google Ads Sitelink Character Limits
Your Google Ads are cutting off in the middle of…
Read more -
What Is Conversion Value in Google Ads?
What if you could put a price tag on every…
Read more

Register for our Free 14-day Trial now!
No credit card required, cancel anytime.