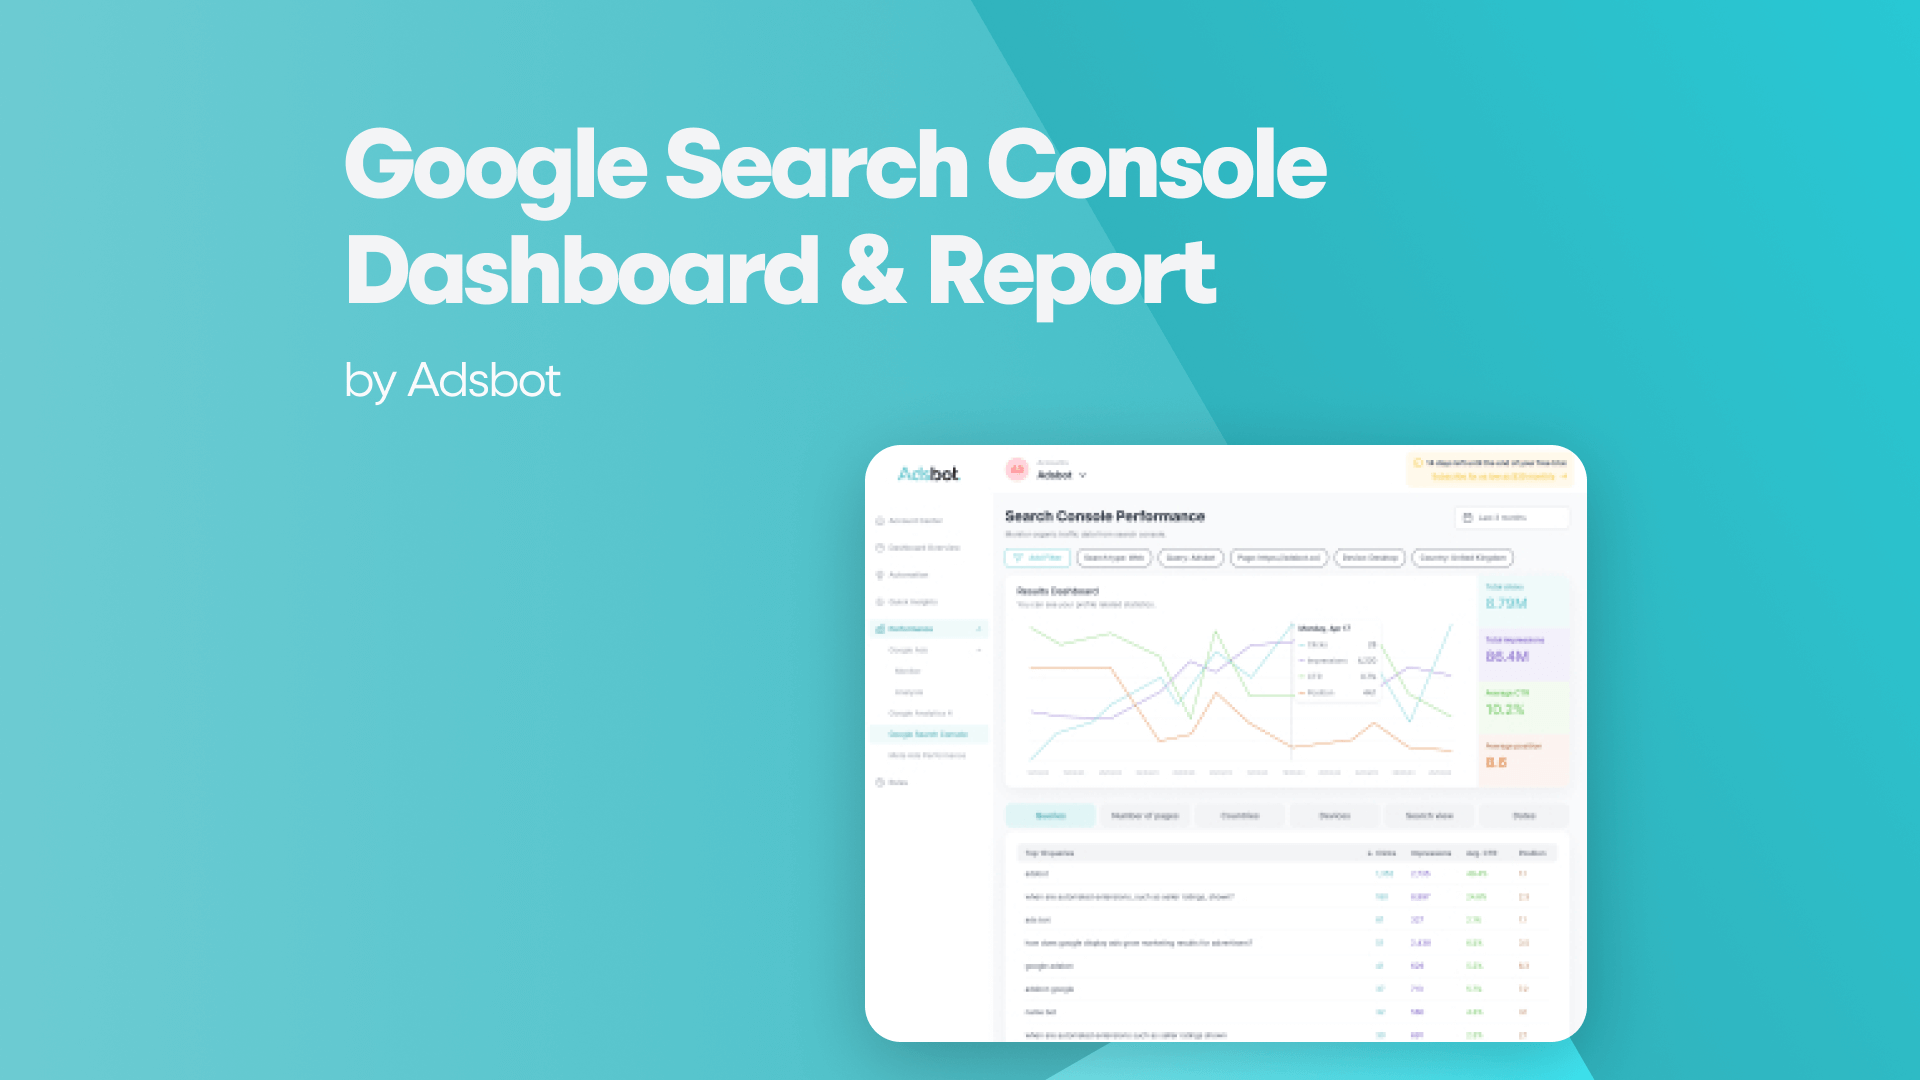
In the fast-paced digital landscape , success hinges on the ability to decipher data, glean insights, and adapt strategies accordingly. Enter the Google Search Console Dashboard of Adsbot– a beacon of light for professionals seeking to optimize their contents. The many features of this adaptable console work together to provide a full picture of your contents’ success, your users’ actions, and your business’s future prospects. Let’s delve into the individual properties that illuminate the power of this search dashboard and report.
The Adsbot Dashboard powered by the Google Search Console presents an extensive array of tools that bestow upon professionals the ability to make well-informed determinations. By diligently scrutinizing the performance of searches and meticulously tracking the manifestation of your website in search outcomes, as well as adeptly diagnosing and rectifying any predicaments that may impede your site’s prominence, this dashboard serves as an invaluable strategic guide.
The interface, which is easy for users, exhibits information about clicks, impressions, click-through rates, and additional metrics, thereby providing valuable insights into the aspects that strike a chord with your target audience. Equipped with this valuable knowledge, you have the ability to meticulously refine their content strategies, elevate the user experience, and make changes necessary for organic traffic. The utilization of the Google Search Console Dashboard serves as an indispensable helper in the relentless pursuit of digital content creation, empowering professionals to deftly traverse the ever-evolving terrain with unwavering assurance.
Total Click: Understanding User Engagement
The measure known as Total Click is the sum of clicks that send the user to a page other than Google Search, Discover, or News. In order to achieve successful content, user engagement must be at the forefront, and it is in this regard that the Google Search Console Dashboard serves as a navigational tool. Through Total Click, we are provided with a tangible metric which showcases how frequently users actively engage with the information that has been presented.
The click-through rate is defined as the proportionality between the number of instances a specified action or hyperlink was exhibited (impressions) and the total of instances it was veritably engaged. It is an evaluative metric that has the capacity to offer profound insights into the performance and efficacy of a particular piece of content. The formula for determining the all-encompassing click rate is ascertained in the subsequent manner:
Click-Through Rate = (Total Clicks / Total Impressions)
For example, if you had 8 clicks and 200 impressions, then your CTR would be 4%. This means that four percent of users who encountered your content decided to click on it.
Total Impression: Measuring Visibility and Reach
Total Impression is a metric that tallies the total count of times a content has been displayed to users, regardless of interaction. Contained within the console dashboard resides a metric of utmost significance, commonly referred to as Total Impression. This metric serves as a reliable indicator, quantifying the magnitude to which your esteemed content has been seen by the eyes of users.
Impressions and engagement are two distinct entities that bear no correlation. In the case that your content is accessed a grand total of 1,000 instances, regardless of the actual number of individuals who actively engaged with your content, the tally of impressions shall remain fixed at 1,000.
If you want to ascertain the extent to which individuals will perceive and encounter their content, there is nothing that surpasses the measure of impressions. Although an abundance of impressions may imply that your content is effectively reaching a vast audience, it fails to provide any insight into the material’s capacity to captivate readers and compel them to engage in the desired actions, such as clicking, converting, or sharing.
Average CTR: The Gateway to Conversion
Average CTR (Click-Through Rate) is a percentage that shows the ratio of clicks to impressions, revealing how effectively yout content draws clicks from its viewers. The feature known as the Average Click-Through Rate is an exceedingly valuable and indispensable font of knowledge. Click-through rates (CTR) serve as a portal to the intricate realm of user conduct, endowing you with a glimpse into the efficacy of your content.
If the average click-through rate for your content is 5%, then that many people, on average, will click on it. Content and links are measured for their effectiveness and relevance using CTR. When the CTR of a material is high, it usually means that it has struck a chord with visitors and is successfully motivating them to take action.
It’s worth noting, though, that what constitutes average CRT or good CTR will vary widely by sector, medium, and content kind. A high click-through rate in one setting may be much lower in another. You may get a fuller picture of your content’s success by comparing your CTR to industry standards and using it in conjunction with other data.
The resonance of your content with consumers and its ability to incite action is heightened when its click-through rate surpasses the industry norm. Conversely, a diminished click-through rate may suggest domains wherein your content strategy could benefit from refinement. Upon acquiring this invaluable information, you shall possess the means to meticulously refine material, harmoniously align it with the user’s objective, and consequently yield elevated rates of conversion.
Average Position: Elevating Your Visibility
Average Position is a number indicating the average rank of your content on search engine results pages; lower numbers denote higher placement.
The placement of your content is very important in search engine results. The property called “Average Position” helps you find your way as you keep looking for better sight. It shows you exactly where your content is in the huge list of search results, so you can figure out if your efforts are getting you closer to the top or if there’s room for more growth. With this useful information, one can carefully tailor their content optimization efforts to improve their standing and make content that is easier to reach.
Country & Device Type: Personalizing the Experience
In the contemporary web, it is unequivocally imperative to possess a comprehensive understanding of one’s target demographic. The term “country” pertains to the geographical locale from which individuals who enter websites or use online platforms gain access to the provided content. Conversely, the designation of “device type” delineates the specific category of electronic apparatus employed by said individuals to engage with digital content, encompassing devices such as smartphones, tablets, laptops, or desktop computers.
Once you identify the countries that are driving engagement and gain an understanding of the devices people are using you can customize your strategies to align with their preferences. This empowers you to create content that truly resonates with your audience and enhances their user experience. Ultimately this results in levels of engagement and conversions.
Growing Content & Popular Content: Nurturing Success
In the Google webmaster tools dashboard, Adsbot provides insights into content trends. The properties of Growing Content and Popular Content serve as indicators for optimizing your content. Growing Content signifies content that’s progressively gaining popularity and visibility due to its relevance and value. Paying attention to the growth in popularity of content can provide insights into your target audience’s preferences. Popular Content represents material that has gained substantial attention, interaction, and sharing from the audience.
Armed with this knowledge you can create more of what resonates with them and adjust your content strategy accordingly. On the other hand Popular Content sheds light on tried and true highlights that consistently capture curiosity. By analyzing the patterns among your pieces of content you can gain a deeper understanding of your audiences desires and needs.
Most Searched Queries & Most Trending Queries: Riding the Wave
Most Searched Queries is the table that shows which queries users see our website the most in Google search results.
Searched Queries and Most Trending Queries provide you with the ability to comprehend the language used by your audience. Most Trending Queries, on the other hand, according to the comparison of the current data with the data from 28 days ago, they are the queries with the highest number of clicks on our website. By uncovering the queries that users are searching for and identifying those that are currently trending you can create content that directly addresses their needs and interests. This approach, driven by keywords ensures that your content aligns with user intent thereby enhancing the relevance and visibility of your content.
Filtering Performance in Search Console
When evaluating your performance across all these properties within Adsbot console, it might be reassuring to have some peace of mind through content filtering. That’s why we offer a filtering option for your Search Console Performance section. This enables you to filter the data according to your preferences, such, as time periods, peaks, outcomes and more.
Google Search Reporting page of Adsbot is not just a tool; it’s a strategic hub of insights that can elevate your digital content. Each property within this dynamic Google search reports offer a unique perspective into your website’s performance, user behavior, and growth opportunities. By harnessing the power of data-driven insights, you can make informed decisions that refine your strategies, drive engagement, and optimize conversions guided by the comprehensive capabilities of Google webmaster console dashboard.
Unlock the power of Google Search reporting and revolutionize your contents today. The Google Console dashboard awaits your exploration.
3x more savings on your advertisement budgets.
Book a demo with one of our onboarding experts.
 Book a call now
Popular Posts
-
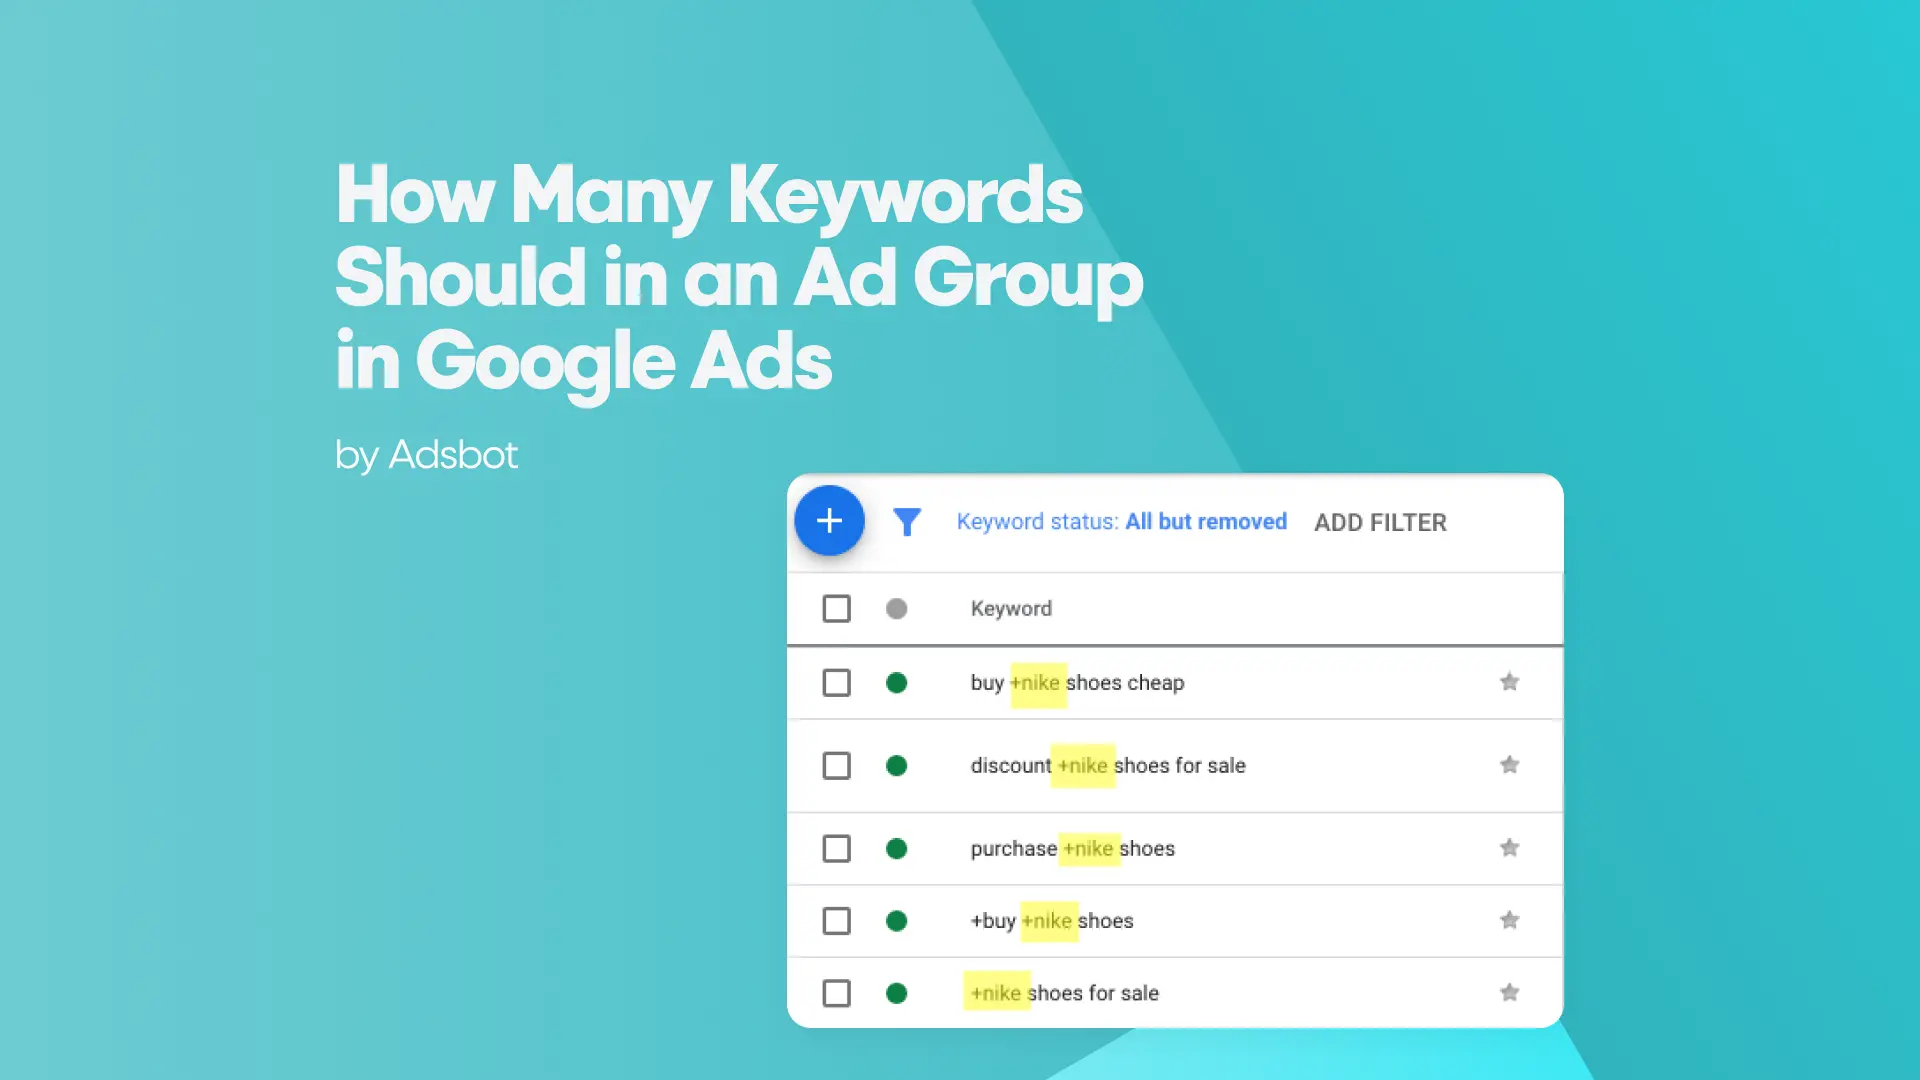
 How Many Keywords Should Be In an Ad Group in Google Ads?
Ever wondered if your Google Ads campaigns are packed with…
Read more -
 Google Ads Script for Dummies: An Introduction
Imagine you have an e-commerce website that sells licensed superhero…
Read more -
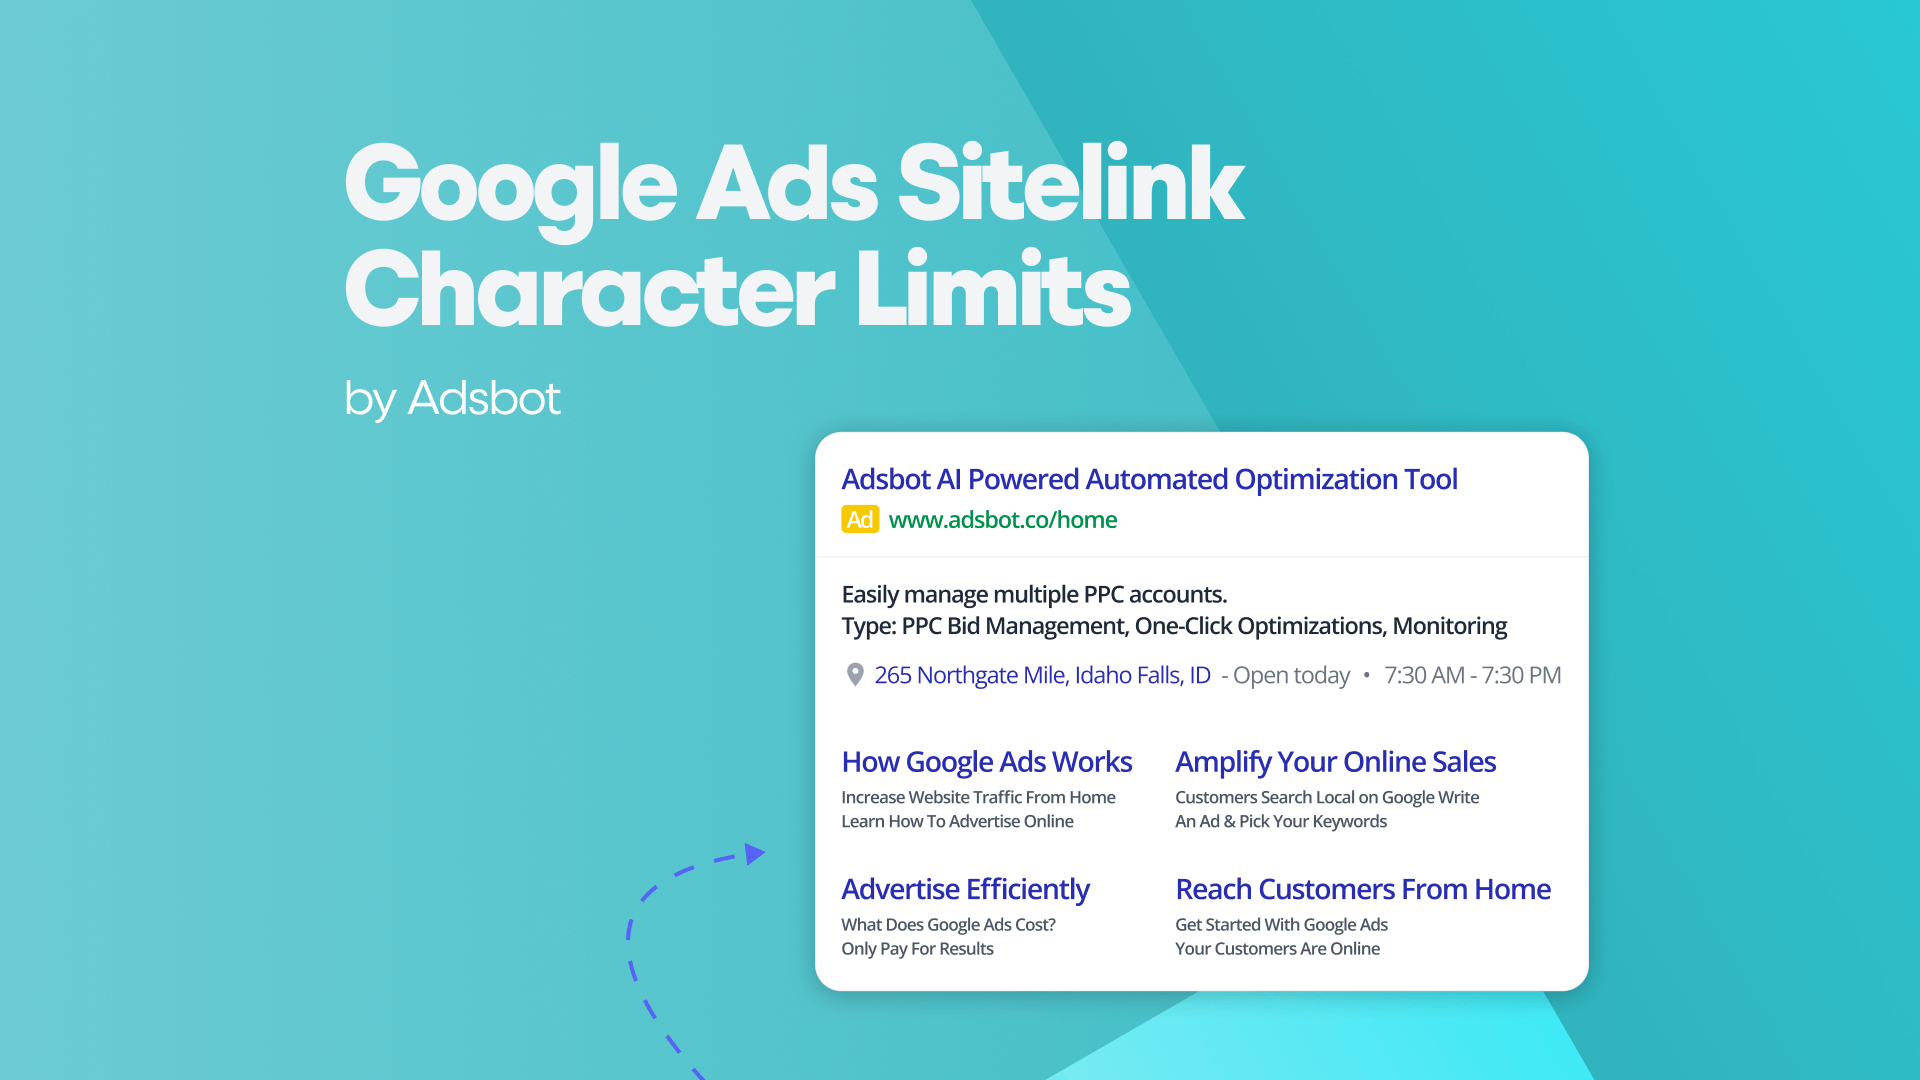
Google Ads Sitelink Character Limits
Your Google Ads are cutting off in the middle of…
Read more -
What Is Conversion Value in Google Ads?
What if you could put a price tag on every…
Read more

Register for our Free 14-day Trial now!
No credit card required, cancel anytime.