Dashboards are always a vital tool for businesses to gain insight into their operations and its performance. They provide an overview of the data in an easy-to-read format, allowing users to explore and analyze trends, identify areas of improvement, and make informed decisions. Dashboards enable companies to monitor more than one process simultaneously, allowing them to identify opportunities for optimization and growth. Many dashboards developed also provide interactive elements to make users explore data at a deeper level and drill into specific areas of focus depending on their goals. Dashboards are an invaluable resource for businesses looking to gain insights from their own data and improve their performance. Continue reading to learn more about dashboards.
Dashboard Design
Dashboard design is a critical component of any successful business intelligence system. Dashboards can be tailored to provide clear visibility of relevant data, enabling users to make informed decisions quickly. Dashboard design should incorporate data visualization techniques to ensure that data can be interpreted at a glance. It should also allow for easy navigation and customizable settings, allowing users to customize the dashboard to answer their needs. Moreover, the design should incorporate security measures and ensure that data is kept safe from unauthorized access. Dashboards should be able to integrate with other systems, providing a more comprehensive view of the business’s performance. Finally, scalability should also be taken into account when designing dashboards, as businesses may need to increase the size or complexity of their dashboard as their operations grow.
Visibility and Efficiency
Dashboards provide visibility into inefficient and outdated processes in the workflow, which can help users monitor operations, optimize processes, and improve overall business performance. A clear view of data, allowing users to quickly identify operational issues, track trends, and generate reports in real-time are provided by most of the dashboards. With the enhanced visibility of dashboard reporting, teams can also quickly identify automation opportunities that can result in big time savings. Plus, dashboarda offer a range of analytics tools to allow users to measure performance against established key performance indicators (KPIs) and identify areas of improvement. Thanks to all these features, dashboards are powerful tools for understanding day-to-day operations and make smarter decisions that will lead to improved business decisions.
Data Analytics
Data analytics is an important part of using dashboards to gain insights into the performance of a business. Dashboards can monitor key performance (KPI) indicators such as customer retention, website traffic, financial performance, and many more. By analyzing data from multiple sources, identifing trends, and uncovering correlations leads to more informed strategic planning for teams. Dashboards can also provide real-time data that allows businesses to act quickly on key insights. Data analytics helps businesses gain a competitive edge by understanding their customers, improving processes, and informing strategy.
Business Insights
Dashboards offer analysts a wealth of insights into their data. They can analyze their past and current trends and take action based on the data provided in the dashboard. Dashboards enable executives to identify areas of improvement and they can lead their teams to focus their efforts on areas that need attention. They also help businesses understand how their products and services perform in the market, which is crucial in product development and marketing strategies. Dashboards provide a comprehensive overview of the status of a business and its operations so that executives can make informed decisions about its future.
Security Measures
Security measures are an essential component of any business dashboard. Because well planned dashboards allow teams to quickly identify threats and take action to mitigate any potential risks. Ensuring that only authorized personnel can access the data is a concern of data security. For that reason, dashboards provide access control and authentication. By incorporating encryption technologies, sensitive data is always being safe and secure. Overall, dashboards offer a detailed security solution that can be tailored to the specific needs of a business.
Integration with Other Systems
Integration with other systems is one of the key benefits of using a well-designed dashboard. Integrations make it easier to monitor operations and optimize processes, as well as improve the overall efficiency of the business. Dashboards can be connected to a variety of other applications, enabling users to have access to up-to-date data across all their systems in one place. By having all the data available in one place, users can access data quickly with a single click. Furthermore, users can make sure that all their data is synced and secure by using a single source of their business data.
Scalability
Scalability is an important factor when it comes to searching for a dashboard. With the amount of data that is constantly moving through pipelines, it’s essential for teams to have access to real-time insights. Dashboards are an effective way to provide such insights, allowing teams to develop scalable solutions for their business. By taking advantage of the scalability of dashboards, businesses can optimize processes and improve overall performance.
Why is Adsbot the Right Dashboard Tool for You?
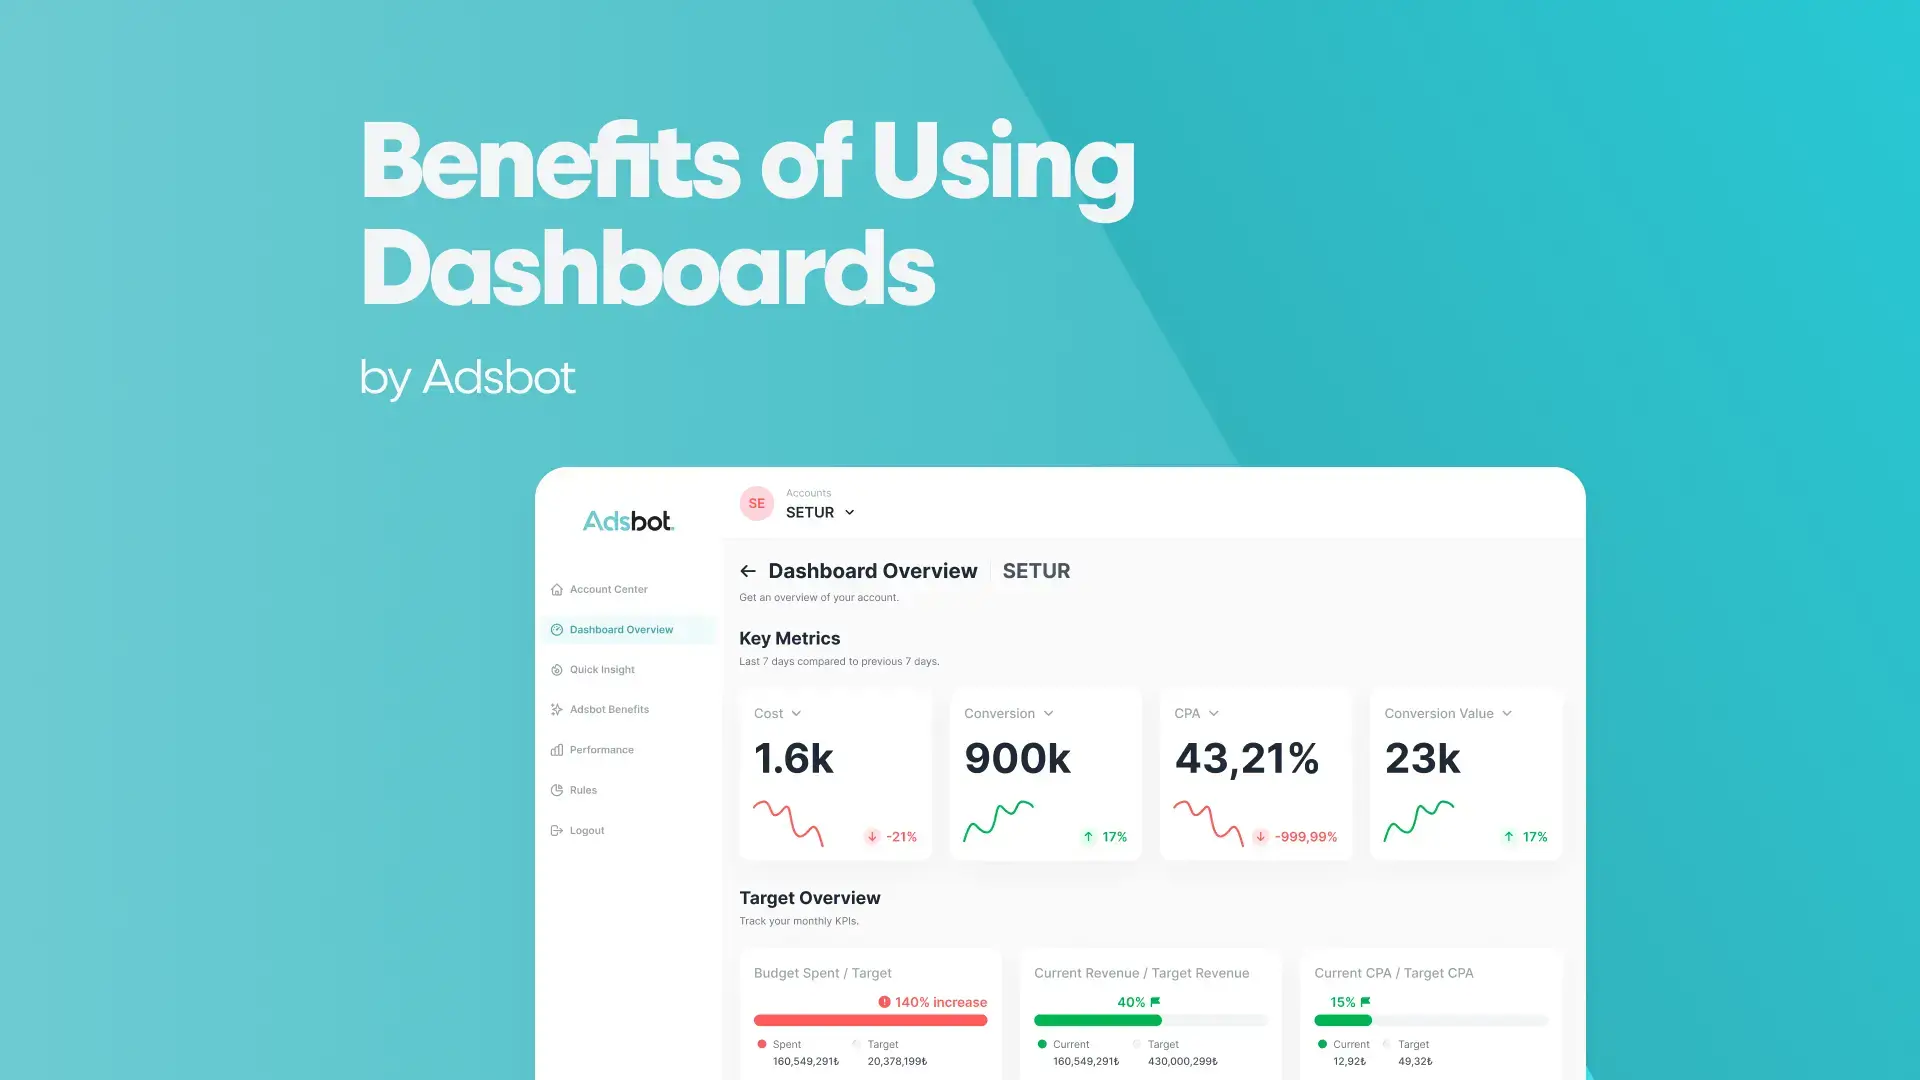
Adsbot is your next-generation analytics software that provides you with a single dashboard for digital marketers. With advanced design and structure, Adsbot allows marketers to discover, monitor and analyze their ad campaigns, from a single dashboard. It is designed to reach KPIs faster and provide an all-in-one dashboard for the use of digital marketing teams. Advertisers can also create their own customized KPI dashboard by choosing any of the metrics and selecting how often reports would be generated, who would receive these reports and when they would receive them. As mentioned above, it is important to design a user-friendly dashboard that enables users to see data insights and take action regarding their analysis. If you are a marketer looking to find the best and easiest way to analyze your complicated data, try Adsbot Performance Dashboard. You will see how Adsbot is easing your daily manual work and report weeks in 14 days free trial period. Try now!
Author:

Get 3x more revenue from the same ad spend.
Let our onboarding experts show you the power of AI-driven PPC optimization.
Start scaling today
Popular Posts
-
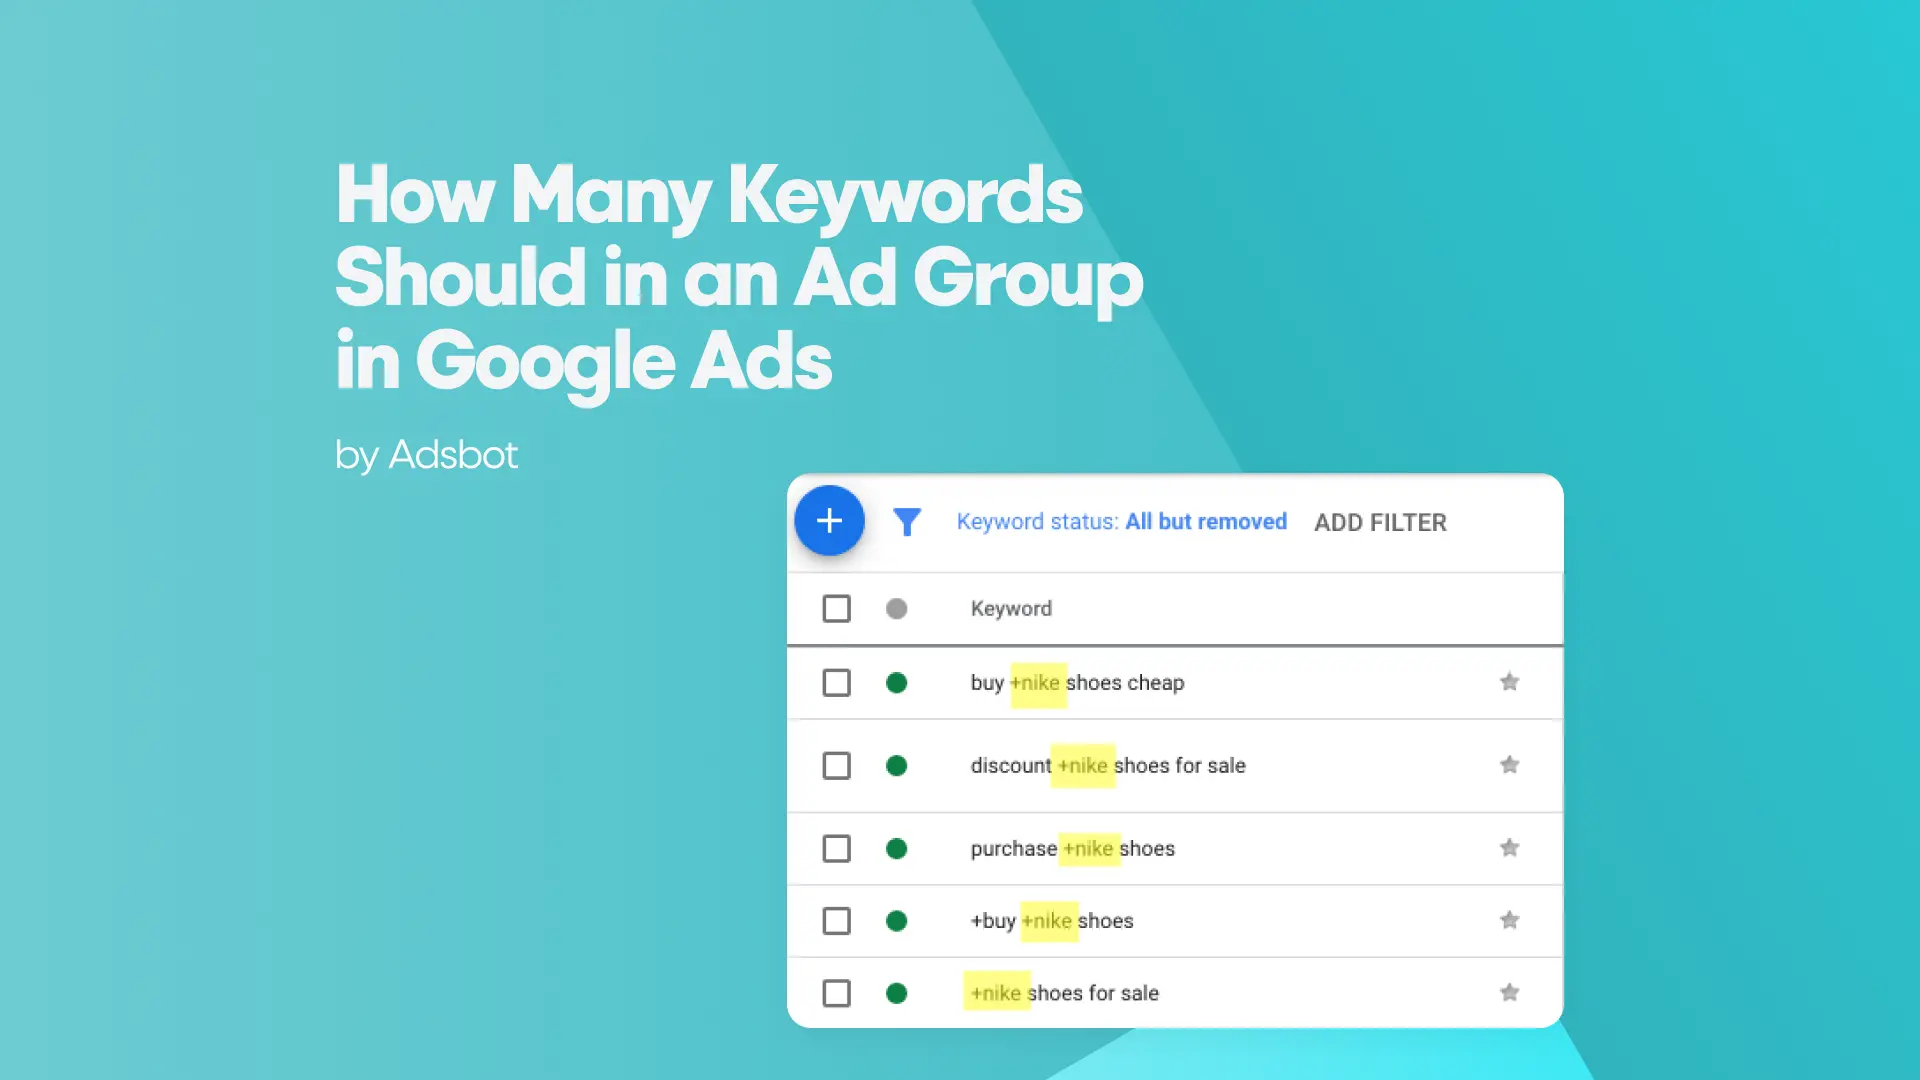
 How Many Keywords Should Be In an Ad Group in Google Ads?
For the vast majority of modern campaigns, the ideal number…
Read more -
 Google Ads Script for Dummies: An Introduction
Imagine you have an e-commerce website that sells licensed superhero…
Read more -
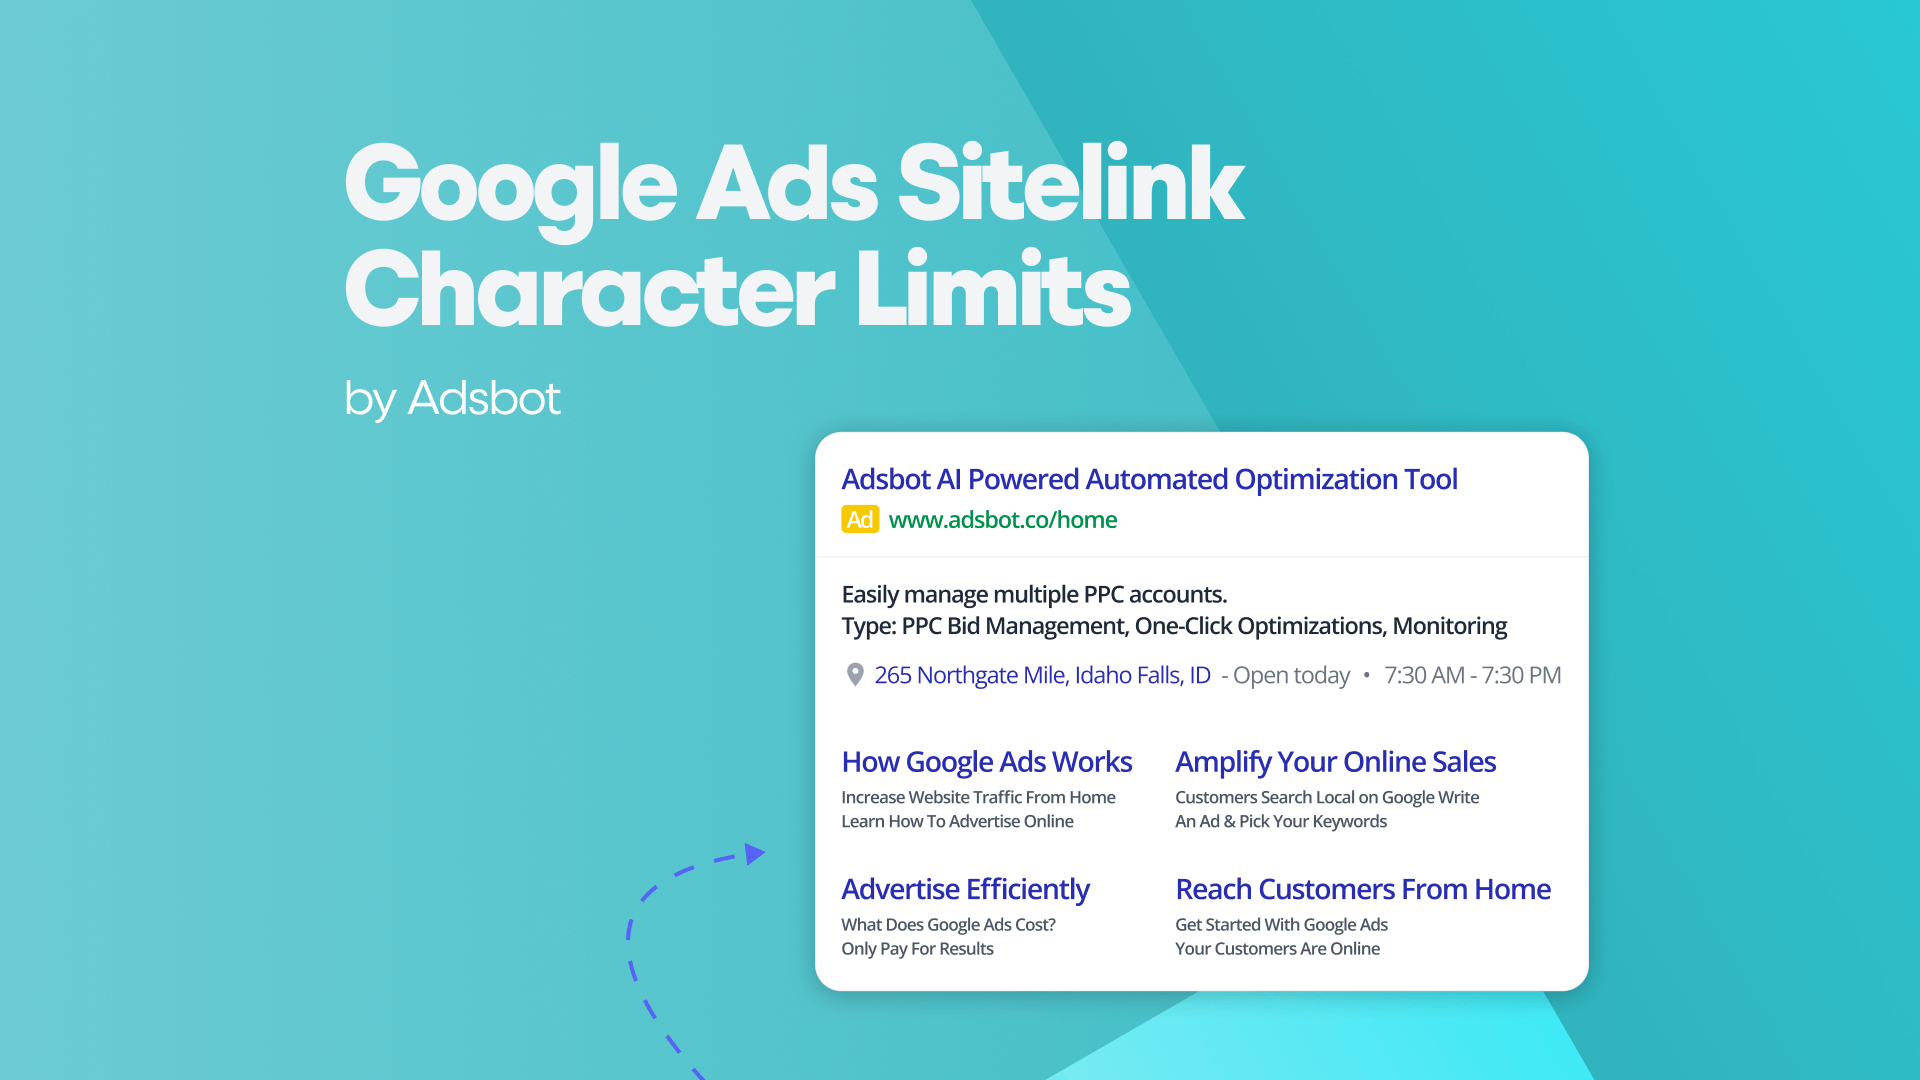
Google Ads Sitelink Character Limits
Your Google Ads are cutting off in the middle of…
Read more -
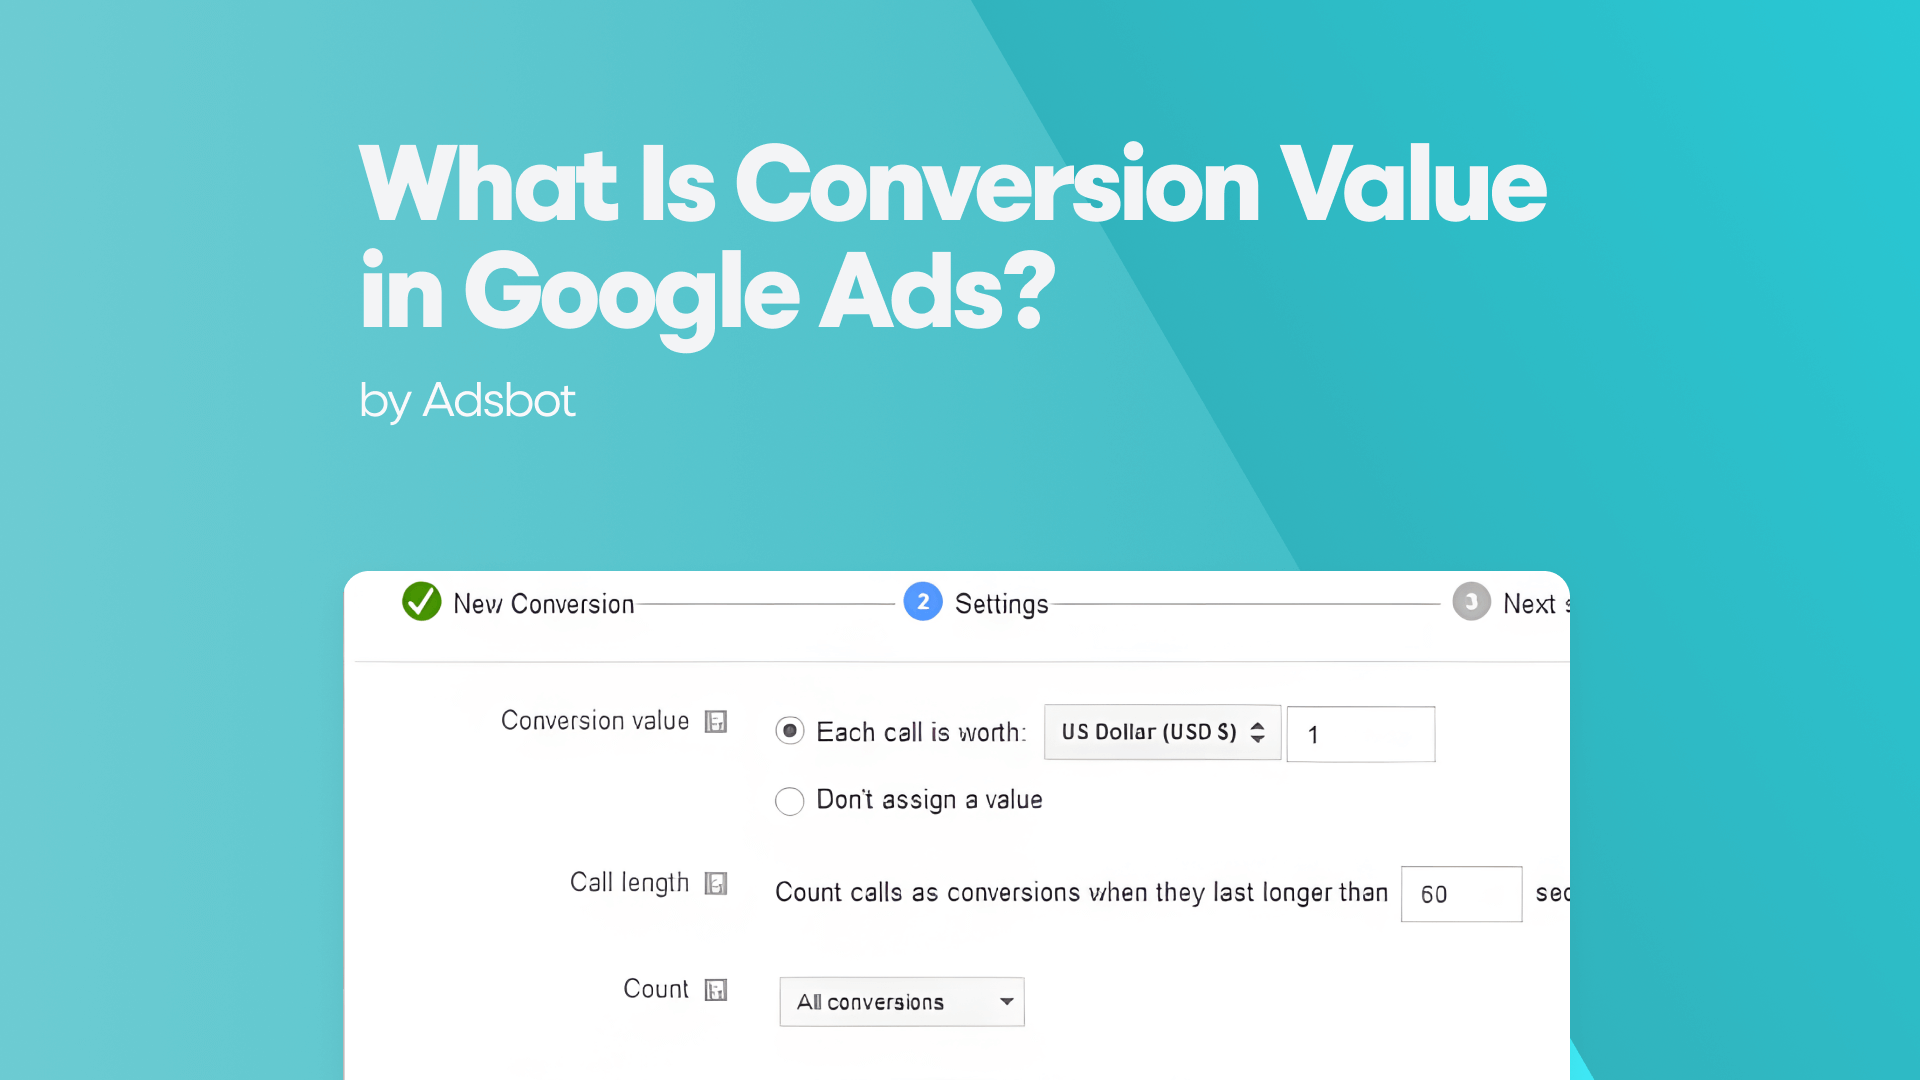
What Is Conversion Value in Google Ads?
What if you could put a price tag on every…
Read more

Register for our Free 14-day Trial now!
No credit card required, cancel anytime.