KPI monitoring tools are a great way to keep track of success metrics, because strategy requires data. They are essentially data analysis tools for businesses to understand how they perform regarding their growth targets.
Keeping track of KPIs manually is a time-consuming task. As a result, marketers require a tool to save valuable time to focus on strategy. That’s where a KPI monitoring software comes in. We’ll explain the importance of measuring key performance indicators (KPIs) and highlight some excellent tools to help you monitor this crucial data.
1. Adsbot
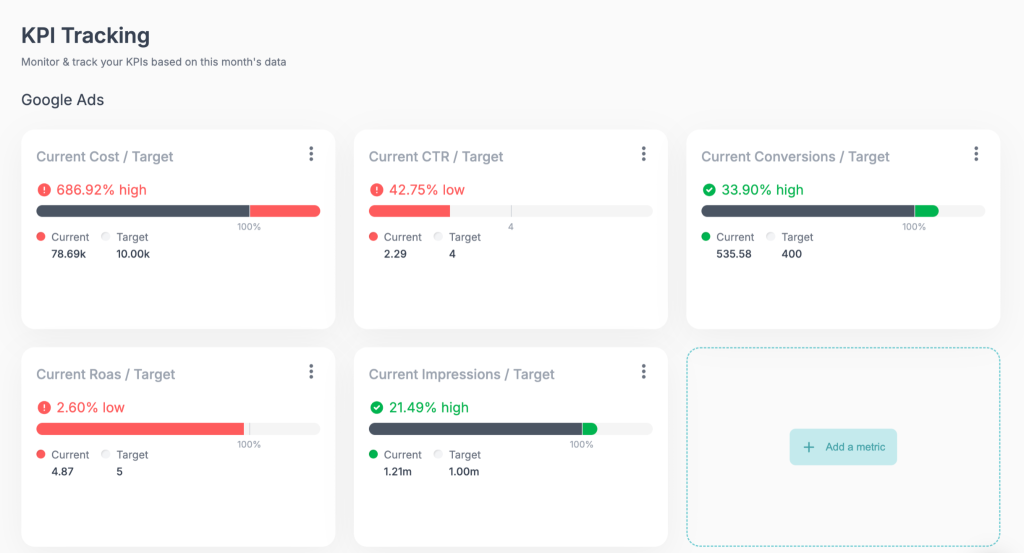
Adsbot is a digital marketing automation and optimization tool designed to help marketers. With its simple dashboards and KPI tracking features, Adsbot stands as a great software to keep track of your key metrics. With its integration with various platforms such as Google Ads, Meta Ads, Google Search Console, Google Analytics and etc, Adsbot pulls endless live data for you to analyze your campaigns.
Along with its simple dashboards, Adsbot also has a feature called “KPI Tracking” where you can manually set targets and keep track of them with your live data. Its simple and powerful interface makes an hour of pulling data into 2-minute daily reviews.
2. Tableau
Tableau is a data visualization analytics platform that helps you get the most out of your data. It helps you build successful KPI dashboards with real-time data, for any audience and any purpose. Tableau is designed to assist you in making data-informed decisions. Companies are swimming in data, but getting the data via visualizations, like KPI dashboards, helps you navigate that data more easily, utilize actionable insights, and enhance your business performance.
3. Asana
Asana is a project management tool that comprises project-based KPI tracking features. It employs a card system that allows users to create tasks, define objectives and deadlines, and designate team members who are accountable for delivering each item. Asana’s KPI tracking system facilitates objectives and key results to enable administrators to align tasks with overall goals. The dashboard offers a tactical overview to enable you to track progress on individual projects.
4. Google Looker Studio
Looker Studio is a Google service that provides the ability for users to effectively and swiftly generate dynamic reports based on various data sources. Data sources can be supplied separately or collectively from other Google services (Google Ads, Google Analytics, etc.), files, and various databases. This provides users with the ability to receive tailored reports on a wide range of subjects, including advertising performance, user engagement, sales, and others. Through the reporting process, users can generate their own reports via Looker Studio, or they can receive numerous reports by merely approving access through various templates available. The provided templates also grant fast access to numerous functionalities.
5. Traditional spreadsheets
Due to their flexibility and broad feature set, spreadsheets remain an important business tool. Above and beyond simple data input, the most useful spreadsheet software accommodates functions like data filtering and visualization, custom formatting, accounting, analysis, project management, and presentations. Spreadsheets assist companies in storing, organizing, and making sense of information. They also allow businesses to model growth or simulate various results using variable inputs. Some of the well-known spreadsheet applications include Microsoft Excel, Google Sheets, Zoho Sheet, and Apple Numbers.
6. HubSpot
HubSpot is a marketing software based on CRM that enables you to organize your marketing and sales operations. You can quantify all your actions in the digital environment with this software, optimize your digital marketing operations, and develop your brand in the digital environment. HubSpot enables you to control your company’s operations from a single dashboard and provides time and cost-saving solutions for marketing, sales, after-sales service, content creation, and process management.
6. Google Analytics
Google Analytics is a free KPI tool that enables users to view what is taking place on their websites in real time and build custom dashboards for monitoring their most vital metrics.
By following what visitors do on a site, it is especially good at revealing how visitors turn into customers. Because it operates alongside other Google tools like Ads and Search Console, users obtain a full view of their marketing statistics.
Google Analytics is free, though it may be challenging for a novice to install and utilize. It takes time to find the desired information and to drill down through the layers of data.
The Dawn of Agentic Analytics and the Autonomous Analyst
As the enterprise landscape reaches a critical inflection point in 2026, the industry is shifting from traditional, descriptive dashboarding toward a paradigm known as Agentic Analytics. This structural transformation, occurring as the global analytic platforms market approaches a $48.6 billion valuation, represents a move beyond mere visualization toward the autonomous orchestration of business outcomes. At the center of this evolution is the rise of the Autonomous Analyst, powered by agentic AI systems that do not simply provide answers to pre-defined queries but independently plan, execute, and verify complex analytical workflows. This democratization of data is largely facilitated by Natural Language Processing (NLP) and Conversational Analytics, which allow non-technical business users to engage in a “data conversation” using plain English to bypass the historical SQL bottleneck. Instead of looking in the “rear-view mirror” at historical data, these modern systems offer predictive insights, forecasting future trends like customer churn or demand spikes, and providing real-time alerts that trigger proactive decision-making. The impact of this shift is measurable, with organizations leveraging AI-driven business intelligence reporting a reduction in decision cycles by an average of 18.2 hours.
Scaling Intelligence with the Semantic Layer and ROI-First Governance
To successfully scale these autonomous innovations, the semantic layer emerged in 2026 as the definitive KPI Truth for the organization. Serving as a centralized translation map, the semantic layer ensures that every AI agent and human analyst operates from a consistent set of business definitions, effectively preventing automated disagreement where different models might produce conflicting reports for the same metric. Furthermore, as AI agents gain more autonomy, businesses are adopting ROI-First Governance and governance as code. This approach replaces slow, static manual reviews with automated policy enforcement and targeted controls that prioritize the specific data paths driving the most business value. Economic efficiency is a primary driver of this trend; organizations that scale AI effectively report up to 20% reductions in data costs. As the distinction between using AI and AI performing analytics continues to collapse, the role of the data professional is fundamentally evolving from a builder of dashboards to an orchestrator of AI workflows, focusing on strategy and ethical considerations while autonomous agents handle mechanical analytical work.
Redefining Performance Metrics through AI-Driven Sentiment and Predictive Quality
As we move deeper into 2026, the criteria for measuring organizational health have shifted from reactive, survey-based data to AI-driven predictive indicators that capture 100% of customer interactions. Traditional KPIs like Customer Satisfaction Score (CSAT), Net Promoter Score (NPS), and Customer Effort Score (CES) are no longer stagnant retrospective figures; instead, they are being replaced by Predictive CSAT and real-time Sentiment Analysis. These systems utilize Natural Language Processing (NLP) to analyze the emotional tone and resolution quality of every conversation, identifying frustration or churn risk accounts before they escalate into cancellations. Furthermore, the rise of agentic systems has introduced new operational metrics such as the Containment Rate, measuring the percentage of inquiries resolved by self-service AI without human intervention, and Cycle Time, which tracks the velocity of autonomous multi-step processes. By integrating these insights with a Customer Health Score, which combines product usage trends and support history, businesses can move from a “rear-view mirror” approach to proactive, context-aware action that protects revenue by flagging at-risk customers in real time.
The Rise of Composable Embedded Analytics and Verticalized Intelligence
The structural layout of business intelligence is further evolving through the decentralization of data via Headless BI and composable analytics. In this era, 80% of employees now consume insights directly within the business applications they use daily, such as CRM and ERP systems, rather than navigating to standalone dashboards. This “analytics everywhere” trend is powered by Embedded Business Intelligence software, such as Tableau, Luzmo, and Sisense, which allows developers to integrate interactive visual dashboards and self-service modeling directly into proprietary SaaS products. Simultaneously, the market is witnessing a move toward Verticalized Intelligence, where domain-specific solutions like Productive for agency management or Abacum for financial planning provide unified workspaces tailored to specific functional requirements. This shift is supported by a Data as a Product (DaaP) mindset within a data mesh architecture, where individual teams own and serve their data as a high-quality product with clear SLAs. As organizations scale these capabilities, they are increasingly adopting consumption-based pricing models, utilizing Data Tokens or query credits to manage the variable costs of AI-driven conversational analytics.
F.A.Q.
What Is KPI Monitoring?
KPI monitoring and reporting is a data analysis done by marketers to evaluate the performance of their ads, websites, and content. KPIs (key performance indicators) are different for every business, so marketers need to determine which KPIs to track.
Is Monitoring KPI Process Hard?
No. Normally, pulling fresh data every day from different ad platforms is a time-consuming task, but with tools like Adsbot, it becomes a lot easier.
Author:

Get 3x more revenue from the same ad spend.
Let our onboarding experts show you the power of AI-driven PPC optimization.
Start scaling today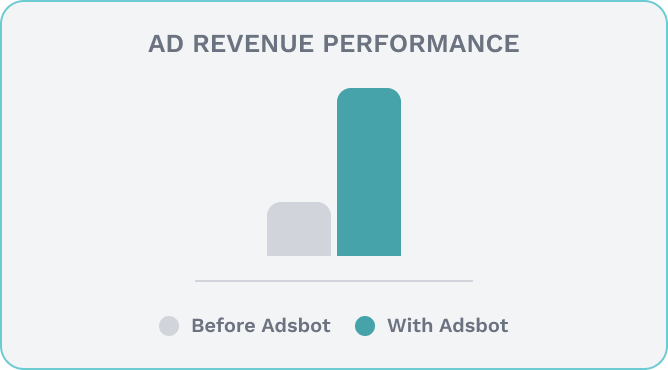
Popular Posts
-
 How Many Keywords Should Be In an Ad Group in Google Ads?
For the vast majority of modern campaigns, the ideal number…
Read more -
 Google Ads Script for Dummies: An Introduction
Imagine you have an e-commerce website that sells licensed superhero…
Read more -
Google Ads Sitelink Character Limits
Your Google Ads are cutting off in the middle of…
Read more -
What Is Conversion Value in Google Ads?
What if you could put a price tag on every…
Read more

Register for our Free 14-day Trial now!
No credit card required, cancel anytime.