There are essential metrics you need to monitor actively about your website visibility, like how users find your website, which pages drive traffic, and also where you’re losing visibility, which are critical for your digital marketing strategy. If you are not looking for the answers to those questions, there is a high risk of missing growth opportunities for your business.
Here comes the Google Search Console Dashboard- the tool to monitor, analyze, and optimize your website’s visibility on Google Search. It shows you the key metrics that matter: how often your site appears in search results, and how easily users are finding you by collecting critical SEO metrics, such as clicks, impressions, CTR, and indexed pages, into one unified view.
Every query, every click, and every impression indicates how your audience perceives and interacts with your brand, guiding you to understand what actions you need to take to improve performance.
By using the search console dashboard effectively, you’ll gain the insights you need to shape your strategies:
- Are your rankings climbing or dropping?
- Which search queries are winning new visitors?
- Where are you losing traffic, and why?
Take Control with the Google Search Console Dashboard
The Google Search Console dashboard provides you with a centralized view of real-time data of your website’s performance on Google Search. You can access and analyze all your critical SEO KPIs through a single customizable interface, without jumping between multiple tabs or piecing together scattered reports.
First of all, let’s take a closer look at the main report that feeds your dashboard with essential SEO metrics.
The Google Search Console Performance Report
The Google Search Console Performance Report is the source of the primary data that collects the essential metrics that define SEO success- clicks, impressions, average position, and CTR across queries, pages, countries, and devices for understanding your website’s search performance. The Performance Report provides the foundation for any meaningful SEO analysis or strategy.
The Performance Report collects essential insights, such as:
- The top search queries bringing users to your site
- Your best-performing pages
- The countries where your audience is coming from
- The devices your visitors use to find you
While Google Search Console offers several other reports, such as Coverage, Mobile Usability, and Enhancements, the Performance Report is the foundation for tracking your organic traffic and keyword success.
Widgets within the Google Search Console Dashboard
Dashboards are essential tools for digital advertising campaigns by transforming data into clear, understandable, and user-friendly formats with a structured interface. And within these visualizations, there are important elements enabling real-time data display: widgets.
You can track your digital marketing performance without getting lost in raw tables, as each of those widgets within the search console dashboard focuses on a particular KPI, like total clicks over time, CTR by query, top landing pages, or device distribution.
Besides, the widget enables visualizing each metric in the most effective way by coming in different formats- charts, tables, and counters.
Within the Google Search Console dashboard, it is easy to choose the widgets according to the priorities of your business model and marketing goals. For instance, while an e-commerce site might focus on top landing pages and mobile device usage, a content publisher might prioritize search queries and impressions over time.
Through those customizable widgets within a well-structured Search Console dashboard, you’re turning complex data into clear direction and measurable SEO results.
Available Metrics, Segments, & Dimensions with Google Search Console Dashboard
Understanding what each metric, segment, and dimension within the Google Search Console Dashboard represents can transform how you engage with SEO performance. Metrics like clicks, impressions, and CTR—along with filters like query, page, device, and country—help you see where your traffic comes from and how users engage with your site.
Key Metrics
- Total Clicks: This metric calculates the number of times users clicked your website after seeing it in Google Search results. This metric shows how motivating your content is to lead the audience to take action. If impressions are high but clicks are low, your content might need more engaging or relevant meta tags.
- Total Impressions: This metric shows the frequency of your site appearing in search results. High impressions with a low click-through rate (CTR) could mean your pages aren’t matching search intent well, or your titles aren’t catching attention.
-
CTR (Click-Through Rate): The percentage of impressions that resulted in clicks. High CTR shows you that your page is a match for the audience, your title and meta description are capturing attention. Accurate CTR calculation is essential for valid analysis.
- Average Position: This metric shows how well your pages perform in search results compared to competitors. It’s an essential metric for tracking keyword performance and page visibility. A lower average position (closer to 1) usually indicates strong relevance and competitiveness, while a higher average position may signal that your content needs better optimization for its target keywords.
Website Health Metrics
- Indexed Pages: The total number of your website pages that Google has indexed. A sudden drop could signal crawling or indexing issues.
- Mobile Usability Issues: Any problems affecting your site’s mobile experience, critical since mobile traffic dominates most industries.
- Coverage Errors: Reports of broken pages, redirects, or access issues that could hurt your SEO visibility.
Segments
- Devices: See whether your visitors come from mobile, desktop, or tablet. Essential for optimizing UX and performance.
- Countries: Analyze where your traffic is coming from geographically—vital for international SEO strategies.
- Search Appearance: Track special result types like rich results, AMP pages, or video snippets.
Dimensions
- Queries: Discover which search terms users are typing to find you. Perfect for keyword optimization and content planning.
- Pages: Analyze the individual performance of your pages—find out which ones are search winners and which need a boost.
- Dates: Spot trends over time, like seasonal spikes or gradual traffic declines, so you can adapt quickly.
Each metric, segment, and dimension gives you a clearer picture. Combined, they give you full control.
Take Your Google Search Console Insights Further with Adsbot
Your Google Search Console dashboard shows you what’s happening.
Adsbot shows you what to do next.
When you integrate your Search Console Dashboard to Adsbot, you will get a user-friendly, easy-to-track all-view for your key SEO performance metrics like clicks, impressions, CTR, and average position, alongside intelligent filters like device type, country, page, and query.
Adsbot detects unusual shifts and automatically alerts you to opportunities and issues. Instead of manually checking reports or missing crucial changes, you stay ahead, making faster, smarter optimization decisions based on live insights.
With Adsbot, you can:
- Automatically monitor changes in your performance
- Get real-time alerts for traffic drops or ranking shifts
- Track your most important SEO KPIs across multiple properties easily
- Save hours by automating reporting and spotting optimization opportunities faster
You can take your Google Search Console dashboard performance to the next level with Adsbot.
Besides, Adsbot enables you to move from monitoring to action with its automation and AI-powered recommendation features.
Ready to try?
Author:

Get 3x more revenue from the same ad spend.
Let our onboarding experts show you the power of AI-driven PPC optimization.
Start scaling today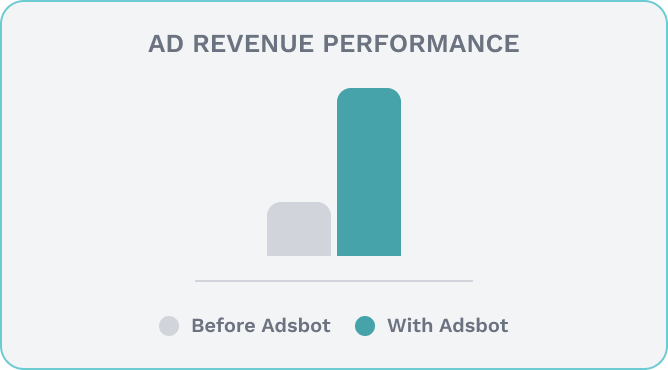
Popular Posts
-
 How Many Keywords Should Be In an Ad Group in Google Ads?
For the vast majority of modern campaigns, the ideal number…
Read more -
 Google Ads Script for Dummies: An Introduction
Imagine you have an e-commerce website that sells licensed superhero…
Read more -
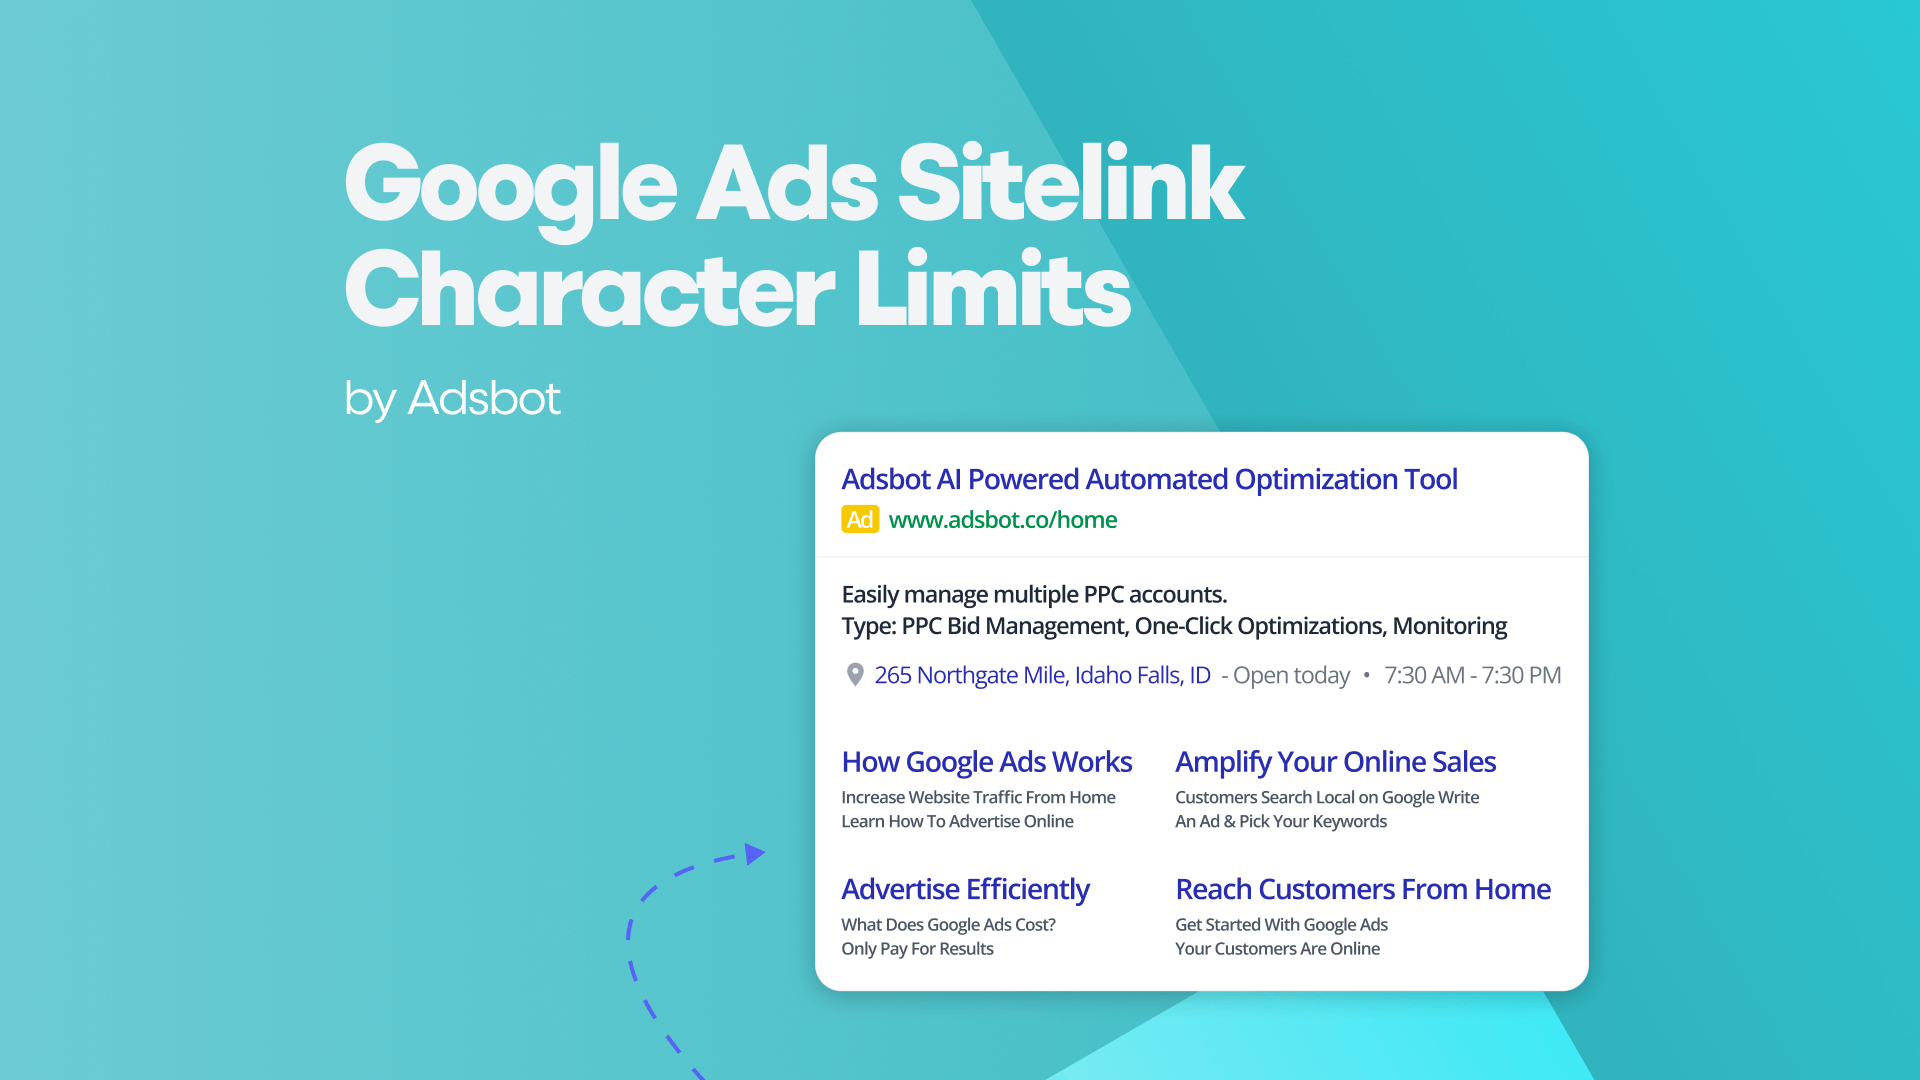
Google Ads Sitelink Character Limits
Your Google Ads are cutting off in the middle of…
Read more -
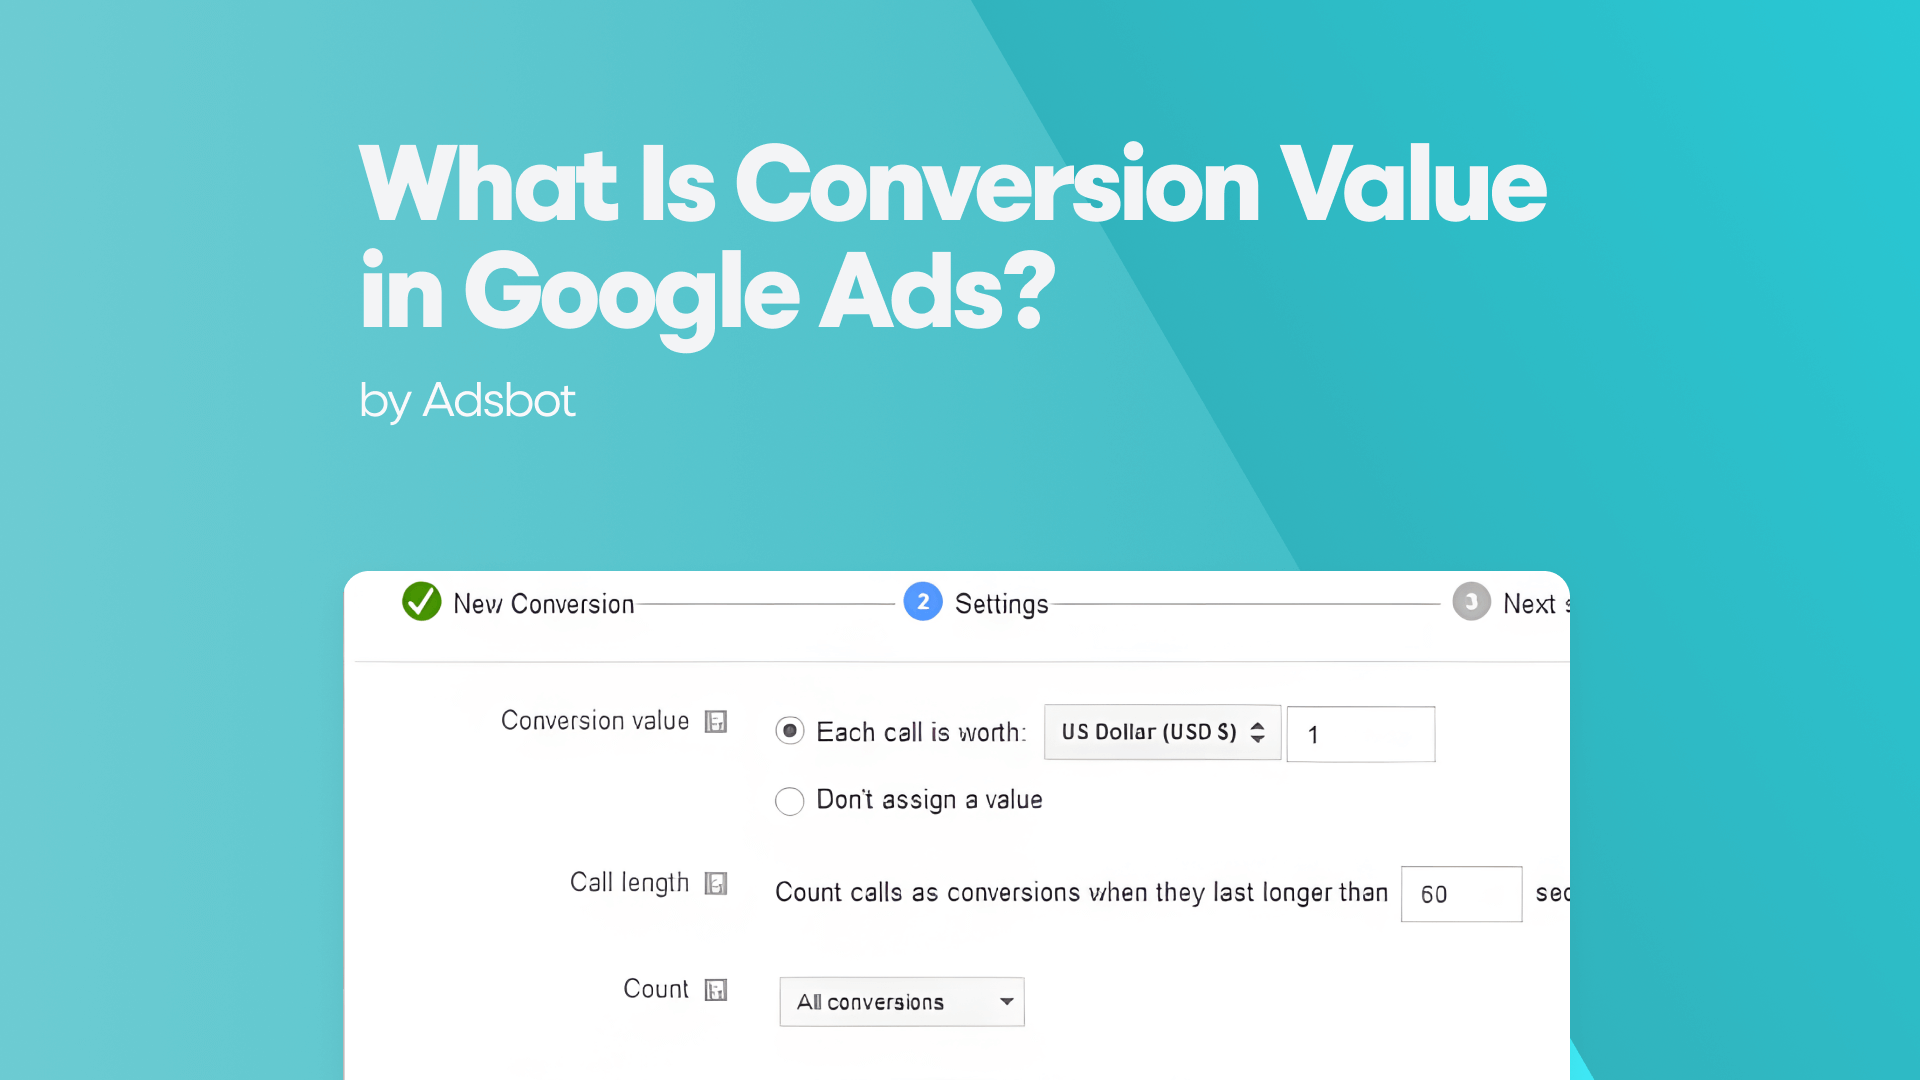
What Is Conversion Value in Google Ads?
What if you could put a price tag on every…
Read more

Register for our Free 14-day Trial now!
No credit card required, cancel anytime.