Every digital marketer pursues some essential questions while building solid and successful advertising strategies. Where your users come from, how they interact with your site, and what drives them to convert are some main critical questions to understand, and there is no doubt how important it is to manage Google ads to reach your audience.
Google has introduced Google Analytics 4 (GA4) to the digital marketing world in 2020. That was an important transformation as GA4 dashboards started to combine web and mobile app data into a single platform. Besides, GA4 dashboards enable you to analyze your data in an engaging way through customizable reporting, including widgets and visualizations.
Another change brought by the GA4 dashboard is that, unlike traditional session-based models, GA4 uses an event-based approach. That means every user interaction (like clicks, scrolls, or video views) is tracked as a distinct event.
With the event-based approach, gaining actionable insights is now easier than ever.
In this guide, we will go through what the Google Analytics 4 dashboard is in detail, what are the changes brought by GA4 compared to Universal Analytics dashboards, how to create and customize dashboards in GA4, and finally, how Adsbot enhances your GA4 dashboard experience, turning raw data into smart insights, automating performance monitoring, and helping you take action faster.
What is a Google Analytics 4 dashboard?
Google Analytics 4 is a free platform designed to make it clear to track audience behaviour. For instance, GA4 helps you figure out how your audience interacts with your brand through your website and app by showing who visits, what they do, and how they behave.
A GA4 dashboard is a customizable interface within this platform to support more efficient marketing efforts by providing organized and visualized data. GA4 dashboards offer real-time data, a user-friendly interface, advanced filters, and customizable reports that help you focus on the metrics that matter most to your business goals. These dashboards allow you to analyze metrics such as user journeys, campaign performance, and conversion trends, giving you a clear picture of how your campaigns are working.
Compared to Universal Analytics
Google Analytics 4 (GA4) has become the new and only platform of Google Ads for tracking and analyzing digital marketing efforts, after Universal Analytics. In July 2023, Google migrated from Universal Analytics to GA4 by introducing new features as an event-based approach to analytics, user-centric data, and machine learning-powered insights.
This shift brings several key innovations :
- Event-based data analysis: Unlike traditional session-based tracking, GA4 tracks every user interaction, such as clicks, scrolls, and video plays, as distinct events, making it easier to understand user behavior in more detail. This enables a deeper analysis of how users truly interact with your content at every step, beyond just pageviews and sessions.
- AI-powered insights and predictions: GA4 uses machine learning to generate automated insights and forecast future actions like churn probability or potential revenue from specific user groups.
- Unified tracking: GA4 integrates data from websites and mobile business, allowing to to track user journey across platforms.
- Improved integration with Google Ads: GA4 provides deeper audience insight for ad campaigns, a clearer understanding of the user journey from impression to conversion.
Why You Should Use Dashboards in GA4
Google Analytics 4 dashboards offer clarity, efficiency, proactive insights, and alignment with your teams and stakeholders, supporting the optimization of your marketing initiatives and driving business growth.
With GA4’s clear and user-friendly dashboards, you can focus only on the metrics that you want to have a closer look at to drive your success. Dashboards in GA4 collect data across platforms, allowing you to analyze efficiently. AI-powered predictions enable proactive identification of opportunities and issues, allowing you to take action beforehand. GA4 dashboards foster alignment across teams through their easy-to-understand features, compelling visuals that simplify complex metrics, and real-time data.
Creating a GA4 dashboard offers several key features that can transform how you interact with your data.
- Event-based analysis model
- AI-powered insights and predictions
- Unified web and app analysis
- Customizable reporting
- Real-time data
- User-centric design
How to create a dashboard in Google Analytics 4
Dashboards have changed significantly with the shift from Universal Analytics to Google Analytics 4, leaving many digital marketers still wondering how to create a dashboard in Google Analytics 4.
Here’s a step-by-step breakdown:
- Open GA4 and go to Explore
In the left menu, click on “Explore” to start a new report. - Choose a template or blank exploration
You can choose from templates like Funnel Analysis, Path Exploration, or start from scratch. - Define your variables
Set your dimensions (e.g., country, device, traffic source) and metrics (e.g., sessions, conversions). - Build your visualizations
Use charts, tables, maps, or custom widgets to visualize your data. - Customize layout and filters
Tailor your view with segments, filters, and date ranges to focus on specific user journeys or behaviors. - Save and share
Once your dashboard is ready, save it for recurring analysis or share it with team members.
GA4 Dashboard Examples: What You Can Build
Here are some GA4 dashboard examples :
- Marketing Performance Dashboard: Track source/medium, campaign performance, bounce rate, and conversion events.
- eCommerce Dashboard: Monitor product views, add-to-cart rates, checkout funnels, and transaction values.
- Content Engagement Dashboard: Analyze page scroll depth, session duration, video engagement, and article shares.
- User Journey Dashboard: Visualize pathing, drop-off points, and cross-device behavior.
Tips to Optimize Your Dashboard GA4 Experience
- Use naming conventions for dimensions and events to keep data clean.
- Schedule regular reviews of dashboards to ensure they reflect current goals.
- Don’t overload dashboards—stick to 5–7 key metrics per view to maintain focus.
- Integrate custom events and parameters to tailor your dashboards to business-specific needs.
And use Adsbot to turn Google Ads analytics into growth and seize new opportunities!
Turn Data into Growth: Using Adsbot with GA4 Dashboard
Whether you’re a digital marketer, a product analyst, or a growth manager, learning how to benefit from dashboards in GA4 is an essential step in making smarter, faster decisions based on real user behavior.
Adsbot, as a PPC management platform, is created with a vision of precision and efficiency, and built for digital marketers seeking smart, automated optimization. Designed for ambitious marketing teams, Adsbot anticipates challenges, acts on opportunities, and drives growth with performance at scale.
While using GA4 dashboards with Adsbot, you will gain clarity, precision, speed, and actionable insights that you need for measurable growth.
Here are the key features of Adsbot that enhance the GA4 dashboard experience:
Custom Dashboard Management: As a digital marketer, you may need to build multiple dashboards for various stakeholders. It could be overwhelming, but Adsbot GA4 dashboards allow you to create and track each one, tailored to the specific needs and objectives of individual marketing campaigns.
- Stakeholder-Specific Views: You can create separate dashboards based on the target audience, such as the creative team, managers, or digital marketers, each focused on the metrics they care about most.
- Ready-to-Use Templates: GA4 dashboard templates are built to match GA4 structures, like traffic acquisition, engagement, and conversion, and will save time.
- Cross-Campaign Filtering: You can filter by channel, source/medium, landing page, or audience segment to get campaign-specific views at a glance by GA4 dashboards in Adsbot
Not only your data from GA4 dashboards, Adsbot integrates data from platforms like Google Ads, Meta, and TikTok, so you can be able to analyze your performance in a complete way through one tool.
Monitoring KPIs and Smart Alerts: While monitoring your key metrics like engagement rate, bounce rate, conversions, and more, you can set customized rules to get alerts. If something goes off track, like drops in conversions or spikes in bounce rate, you get real-time alerts.
Automated Actions: Automated rules for specific actions like adjusting bids, pausing campaigns, reallocating budget without manual work, while using the GA4 dashboard will free your time.
AI-Powered Optimization Suggestions: Based on historical data and trend patterns in GA4, Adsbot recommends actions like pausing underperforming pages, reallocating budget, or shifting focus to higher-converting traffic sources.
Time-Saving Customized Reports: Ready-to-use templates, user-friendly and customizable reports, and insightful suggestions will be generated through Adsbot GA4 Dashboard, which are perfect for teams, agencies, and client presentations.
Make your GA4 dashboard experience efficient, smart, and optimized! Try Adsbot today.
Author:

Get 3x more revenue from the same ad spend.
Let our onboarding experts show you the power of AI-driven PPC optimization.
Start scaling today
Popular Posts
-
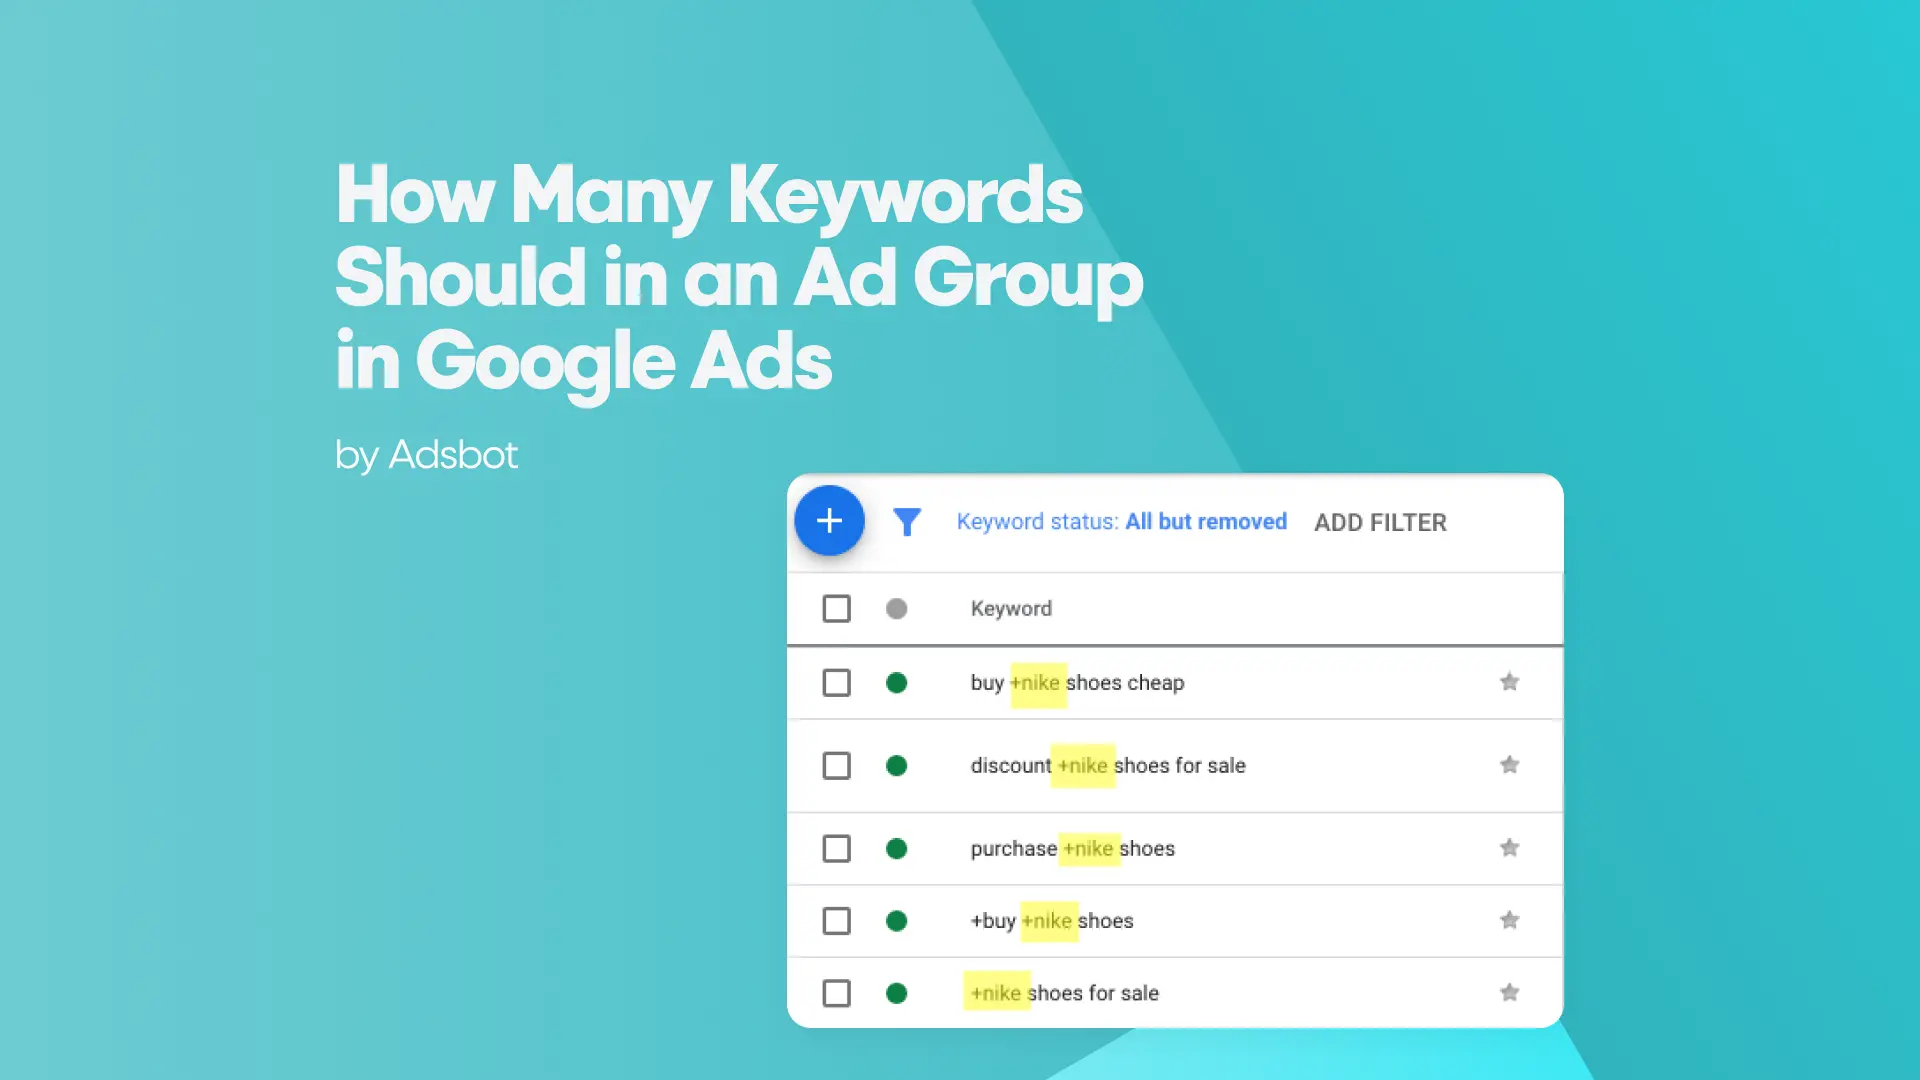
 How Many Keywords Should Be In an Ad Group in Google Ads?
For the vast majority of modern campaigns, the ideal number…
Read more -
 Google Ads Script for Dummies: An Introduction
Imagine you have an e-commerce website that sells licensed superhero…
Read more -
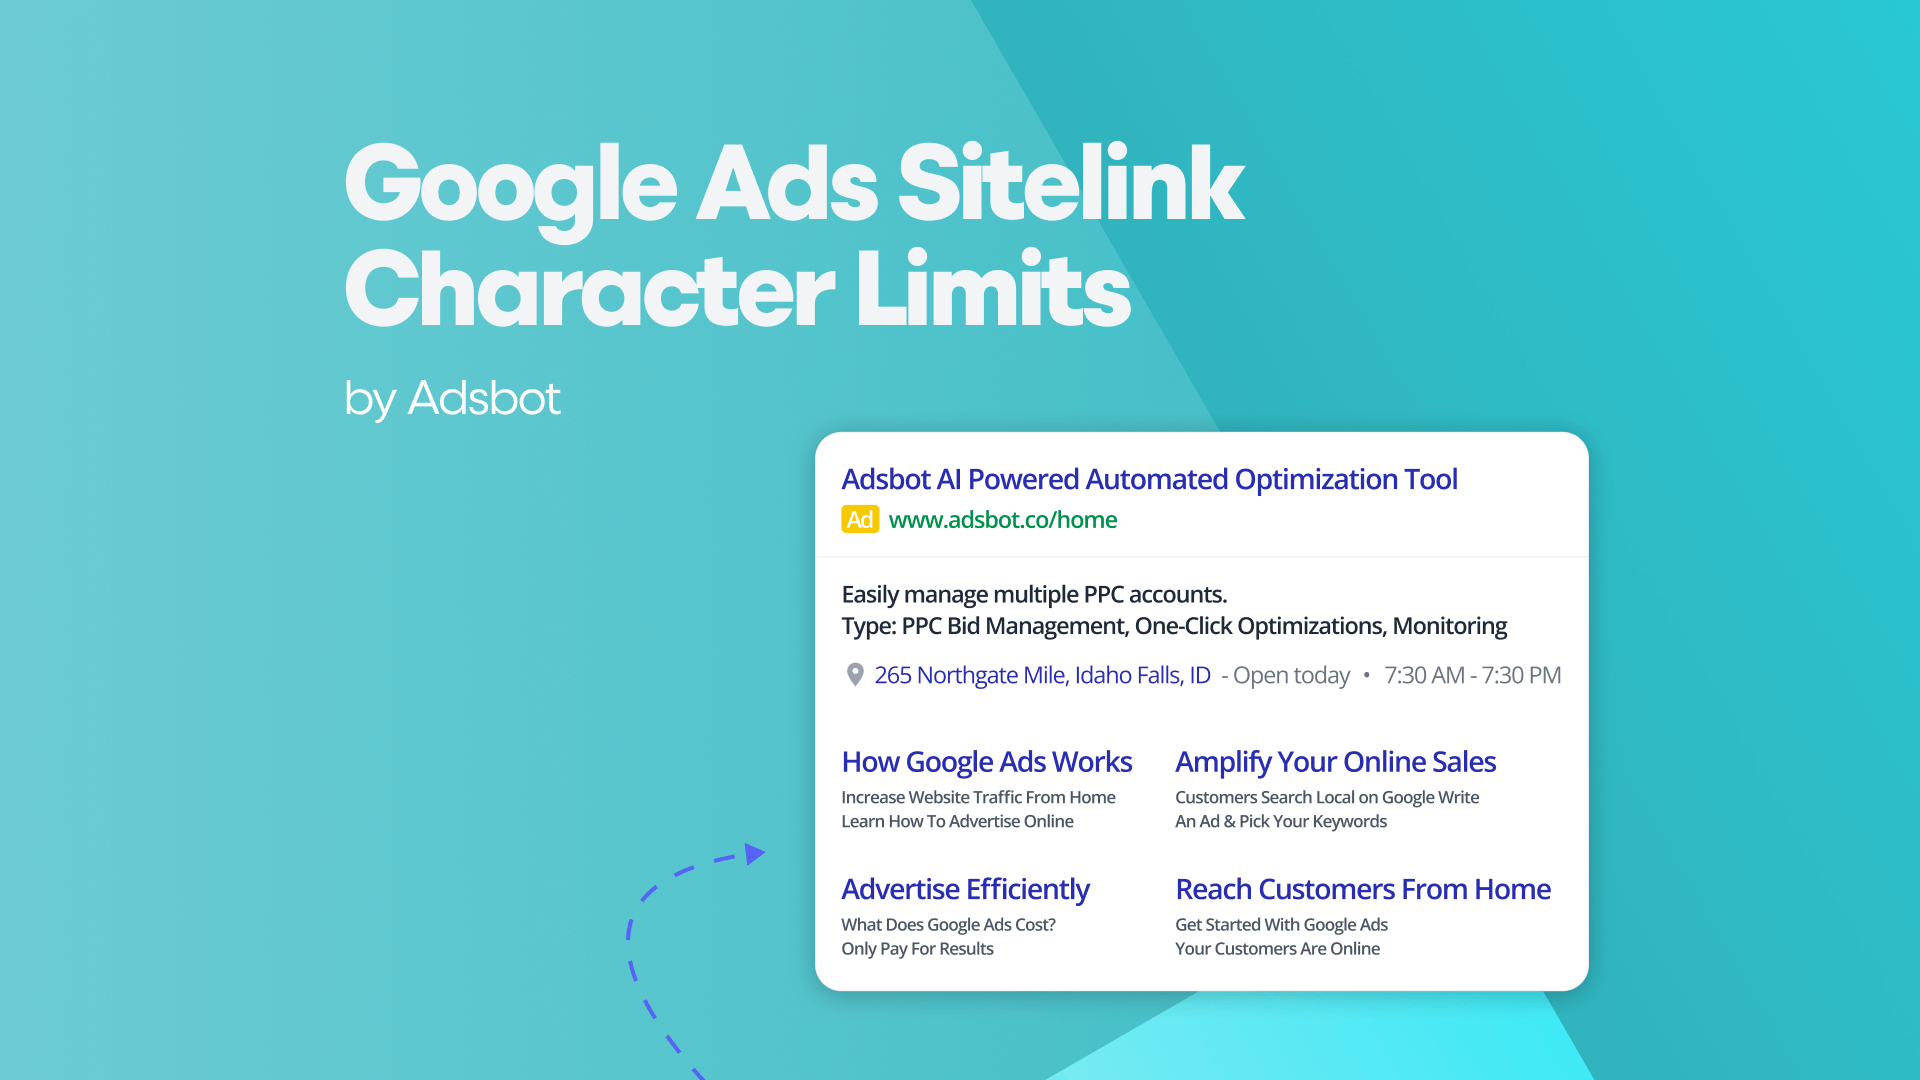
Google Ads Sitelink Character Limits
Your Google Ads are cutting off in the middle of…
Read more -
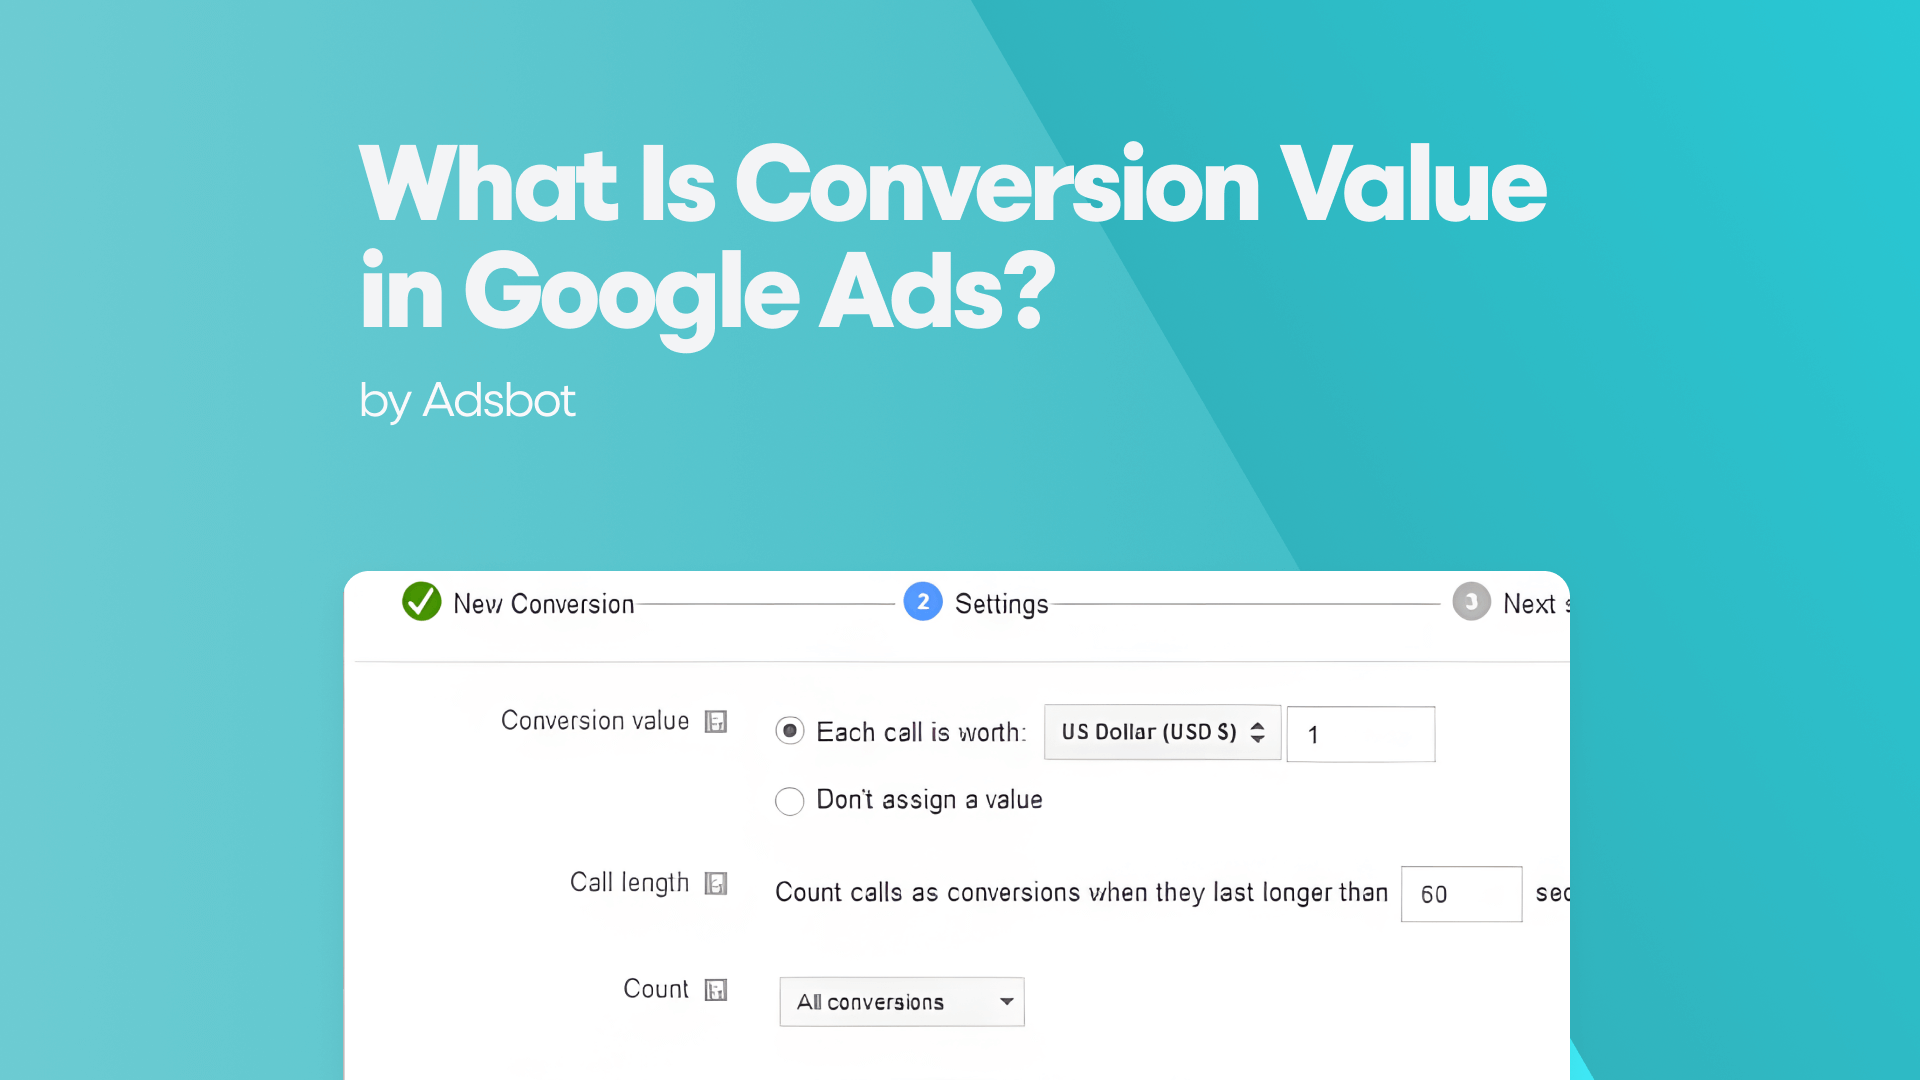
What Is Conversion Value in Google Ads?
What if you could put a price tag on every…
Read more

Register for our Free 14-day Trial now!
No credit card required, cancel anytime.