Platform Dashboards
Track 10+ Platforms From a Single Source
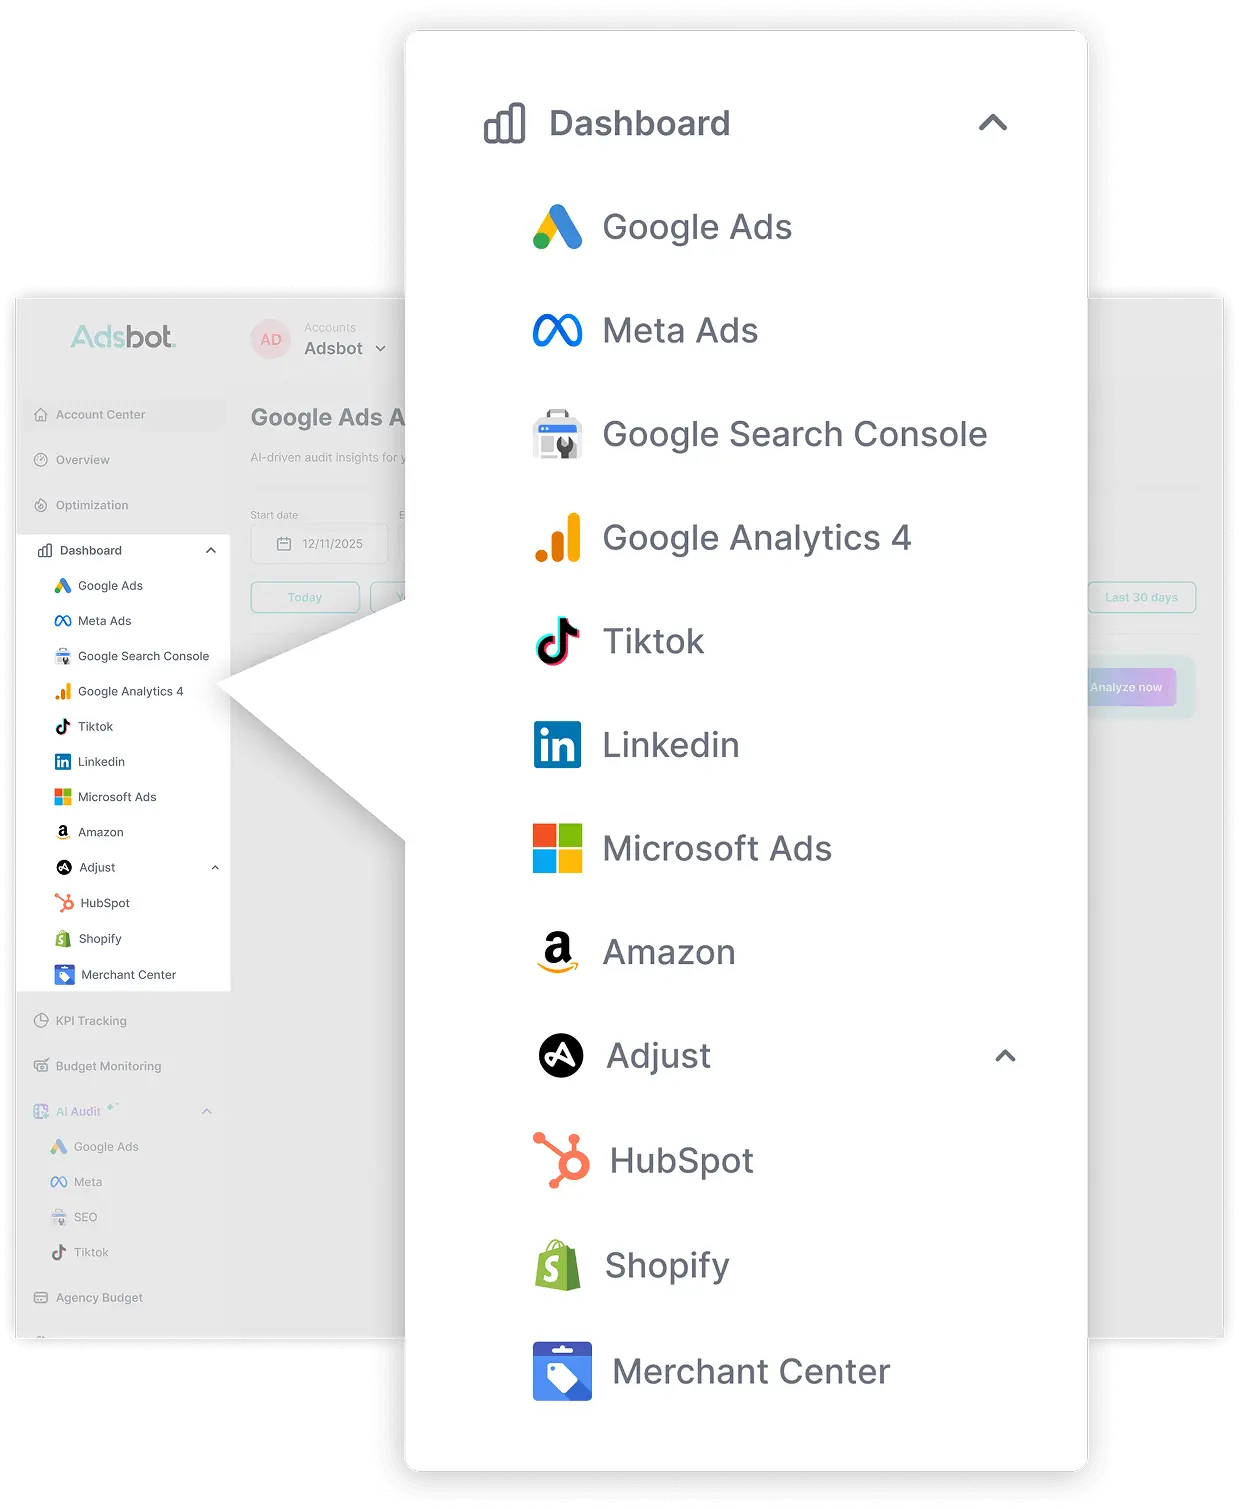
Adsbot is the only dashboard tool that unifies your entire marketing stack. Track Google, Meta, TikTok, LinkedIn, Microsoft, Amazon, Shopify, Adjust, GA4, and Search Console from a single platform. Stop juggling logins and start seeing the full picture of your performance, from ad spend to traffic in a single, powerful view.


The End of Data Chaos
- One Tab to Rule Them All: Your whole data lives in one unified sidebar. Click, switch, and analyze in seconds, not minutes.
- Platform-Native Depth: We don’t water down your data. Access advanced metrics like Google Day & Hour heatmaps, Microsoft Quality Scores, Shopify Inventory flow, and more directly in our dedicated platform tabs.
- Instant Performance Clarity: Don't wait for weekly syncs to spot a problem. Monitor real-time metrics across every channel instantly, allowing you to catch wasted spend and capitalize on trends the moment they emerge.

Google Ads Dashboard
Drill Deeper Than Just Clicks and Impressions
Get a panoramic view of your entire Google ecosystem. Toggle instantly between metrics like Clicks, Impressions, Cost, Conversions, and more to see the real story behind the spend. Analyze Quality Scores to lower costs, use Day & Hour heatmaps to perfect your scheduling, and identify exactly which creative assets, from Search to YouTube, are driving your ROI.
Total visibility, zero guesswork.
Meta Ads Dashboard
Decode the Algorithm, Scale the Profit
Social advertising is volatile, but your strategy shouldn't be. Stop guessing if it was the Reel or the Story that converted. Track every critical metric like Reach, Impressions, Amount Spent, Results, and much more in one view. Our Meta dashboard visualizes performance by placement, demographic, and device with surgical precision, so you can cut the dead weight and double down on what’s actually printing money.
Stop funding the void. Start funding the winners.
Google Search Console Dashboard
Dominate the SERP
Organic traffic is free, but it’s not accidental. Monitor your Total Clicks, Total Impressions, Average CTR, and Average Position in real-time. Identify high-potential keywords that are just one optimization away from ranking #1, and spot the cannibalization between your paid and organic efforts instantly.
Unlock the hidden revenue in your organic search.
Google Analytics 4 Dashboard
Stop Tracking Sessions.
Start Tracking Users.
Universal Analytics is dead; long live the user journey. Our GA4 dashboard cuts through the noise of the new interface to show you what matters: Users, New Users, Engagement Rate, and Event Count. Understand exactly how people interact with your site, not just how many times they visited, and trace the full cross-platform path to conversion.
The full picture, from first click to final sale.
TikTok Ads Dashboard
Stop the Scroll. Start the Sale.
Viral trends move fast, and your reporting needs to keep up. Visualize your Cost, Impressions, Clicks, and Conversions instantly to see if your creative is hitting the mark or just burning cash. Drill down into audience demographics and device data to ensure your ads aren't just getting views, but actually driving profitable action.
Don't just go viral. Go profitable.
Microsoft Ads Dashboard
Tap Into the High-Value Audience You’re Missing
Microsoft audiences spend more; make sure you aren't spending more to get them. Monitor Spend, Avg. CPC, and Conversions to maximize ROAS on Bing and beyond. Use our Quality Score Report to slash entry costs and the Day Analysis heatmap to target users exactly when they are ready to buy, ensuring you never pay for a click that doesn't count.
High intent, lower competition, maximum return.
Amazon Ads Dashboard
Don't Just Sell.
Dominate the Buy Box.
Marketplace margins are razor-thin; your reporting needs to be razor-sharp. Track ACoS, ROAS, Orders, and Sales to ensure every dollar spent is profitable. Monitor inventory velocity alongside ad performance to prevent stockouts and identify exactly which ASINs are scaling your brand and which are just eating your profit margin.
Win the shelf, own the category.
Adjust Dashboard
Stop Buying Installs. Start Buying Revenue.
Downloads are a vanity metric if users churn on day one. Track Installs, DAU, Revenue, and Cohorts to uncover the true LTV of your users. Visualize retention curves to pinpoint exactly when users drop off, and optimize your ad spend toward the channels that deliver loyal customers, not just fleeting installs.
Growth that sticks, revenue that scales.
Shopify Dashboard
Your Entire Store Health, At a Glance
Ads bring them in, but your store is where the magic happens. Monitor Total Sales, Average Order Value (AOV), Orders, and Returning Customer Rate in real-time. Identify your top-selling products instantly and spot inventory bottlenecks before they kill your momentum. It’s the pulse of your business, simplified.
From traffic to transaction, see it all.
Frequently Asked Questions
Adsbot offers native, one-click integrations for over 10 major platforms, including Google Ads, Meta Ads, TikTok Ads, LinkedIn Ads, Microsoft Ads, Amazon Ads, Shopify, Adjust, Google Analytics 4 (GA4), and Google Search Console. You can view data from all of these sources in a single, unified sidebar.
Yes. We pull data directly from platform APIs to ensure your dashboard reflects the most current performance metrics available. This allows for instant decision-making and immediate optimization without waiting for daily or weekly sync delays.
By connecting Shopify, you can see actual Revenue, Average Order Value (AOV), and Returning Customer Rates alongside your ad spend. This allows you to measure true ROAS based on real sales data rather than just pixel estimates, closing the loop between ad spend and bankable revenue.
No. Adsbot is a completely no-code platform. You simply log in with your existing platform credentials (e.g., your Google or Facebook login), and our system automatically populates the dashboards with your historical and real-time data immediately.
Still not convinced?
Register for our Free 14-day Trial now!
No credit card required, cancel anytime.
Try Adsbot